This guide is designed for someone that has never performed a packet capture before or may have had to a few times but really did not understand it. Many times the packet capture can seem like a needle in a haystack.
Brief History
Wireshark has been around for quite some time. In 1998 it was called ethereal but had to change its name. You can find a full history of that on their Wikipedia page – https://en.wikipedia.org/wiki/Wireshark
On the installation, most of the defaults should work. On the machine you want to perform the capture on, make sure winpcap or now npcap are installed. That is what allows the packets to actually get captured on windows. UNIX like operating systems already come with the necessary libraries.
Capture Packets!
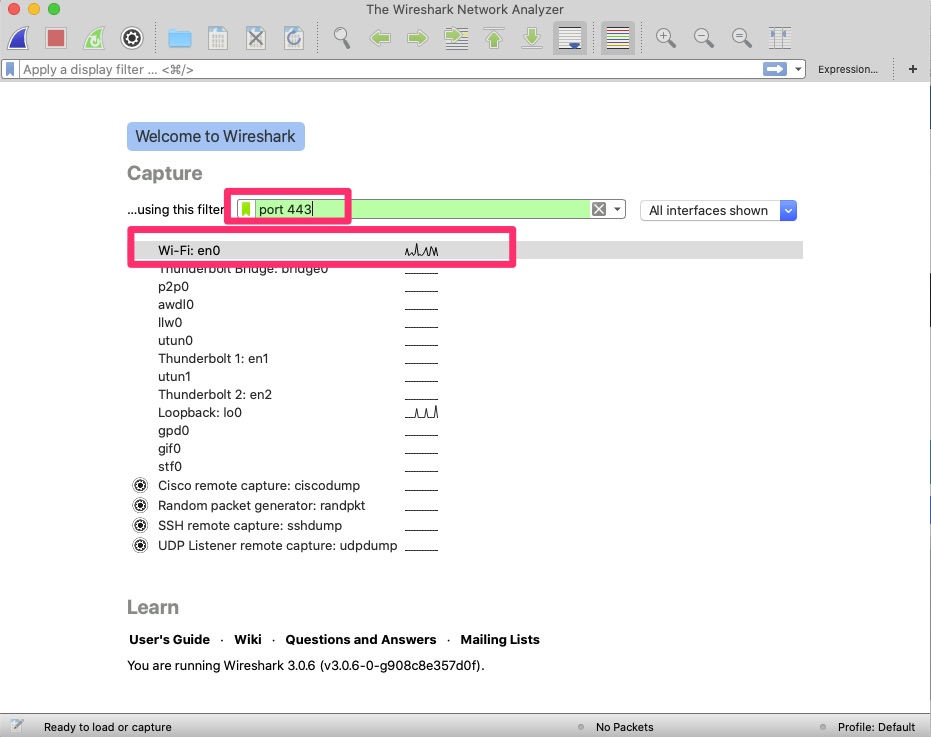
Here we will filter based on port 443 as we intend to make a connection to https://blog.woohoosvcs.com on port 443. First we need to select the adapter though. If you’re unsure of which one, you can see the traffic graph (squiggly lines). If you type the capture filter first and then change the adapter the filter will clear.
Filter based on port 443 for HTTPS and on the Wi-Fi adapter.
We want to limit the capture as much as possible because there will be a lot of traffic without a filter. Be careful though as filtering too much can lead to not capturing the intended packets.
Next I will curl or make a connection to https://blog.woohoosvcs.com
I am using curl -v so that I can see the IP address. This is an ipv6 address.
% curl -v https://blog.woohoosvcs.com0*   Trying 2606:4700:20::681a:d78...
* TCP_NODELAY set
* Connected to blog.woohoosvcs.com (2606:4700:20::681a:d78) port 443 (#0)
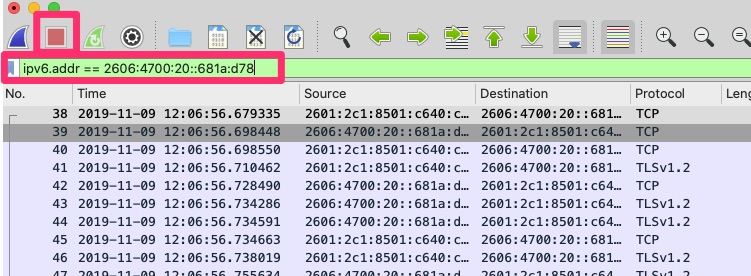
After running curl we want to click the red square button in wireshark to stop the capture. These can grow rather large.
We can then set a display filter to the ip address 2606:4700:20::681a:d78
ipv6.addr == 2606:4700:20::681a:d78
This helps us narrow down to just the packets necessary that we want to analyze. The capture filter restricts the packets that wireshark even sees coming from pcap. The display filter does just that. It filters what you are displaying but all the other packets it captured are still there.
Analyzing Packet
TCP Handshake
The first step to any TCP connection like HTTPS is a 3-way handshake. In TCP, it is a stateful connection protocol. It uses flags or options to help keep track of the connection. When making a new connection from my machine (A) to blog.woohoosvcs.com (B) the handshake looks roughly like this
A – > B (flag: SYN) – A is telling B it wants to make a new connection. B -> A (flag: SYN+ACK) – B is telling A it “ACKnowledges” the original SYN and agrees to the connection with its own SYN A -> B (flag: SYN) – A is telling B it ACKs the SYN from B
Visually we see that here
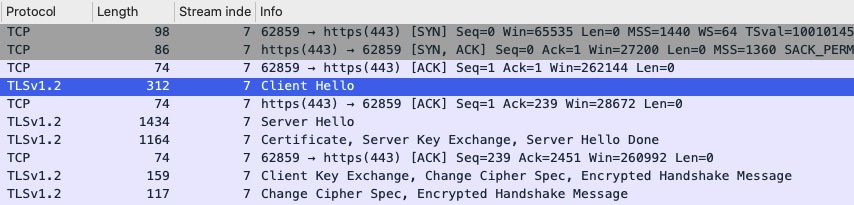
3 Way Handshake of packet capture
Many instances if the remote end does not want to accept your packet, it simply will not respond. You may see your SYN sent and nothing in return and SYN retries happening. Other times if it forcefully wants to deny the connection instead of SYN+ACK you will get an RST or RST+ACK in the response from the remote end.
Now that the connection is open and established, we can inspect the TLS handshake.
TLS Handshake
TLS Handshake from Packet Capture
In the above, right below the 3 way handshake we can see a TLS “Client Hello”. This is similar to the 3 way handshake except for TLS. The client, in this case “curl” is trying to negotiate compatible methods of communication.
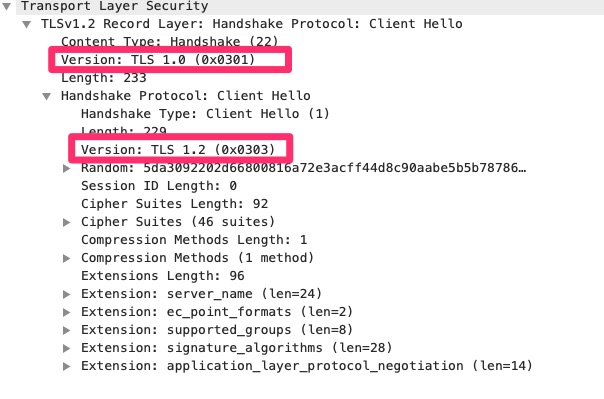
TLS Client Hello
We cannot actually see the packets captured but we can see metadata about the TLS connection. The higlighted areas above may be confusing. Why is it announcing two different TLS versions. At the record level it is announcing TLS 1.0. This is the lowest version the client is indicating it supports. At the client hello envelope it is announcing TLS 1.2 which is the highest it supports. This tells the server anywhere between TLS 1.0 and 1.2.
Looking at the screenshot you can see other proposed settings that client is recommending/offering. The other main one are the cipher suites. What encryption methods does the client support.
The client is much like a catcher in baseball. It proposes the pitches or connection parameters. The server or pitcher just says yes or no.
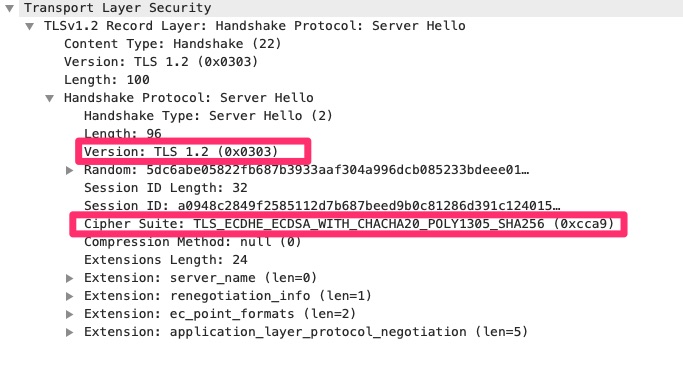
TLS Server Hello
Here we can see the TLS 1.2 protocol was selected and a singular cipher suite. Many times the Server Hello is where it fails if the server requires a TLS version the client does not support or a cipher suite the client does not support. On this blog we have it set to require tls 1.2 or higher.
Forcing to Fail TLS Handshake
I will instruct curl to connect with TLS 1.0 as the max
As you can see, the client complains but what does the capture look like?
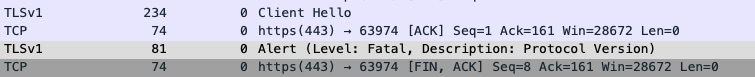
TLS Handshake error – Fatal – Protocol Version
In the capture above you can see the client hello. It specifies a max of TLS 1.0. In the 3rd packet you can see the server responding with an Alert instead of Server Hello and the 4th packet the server is actually closing the connection due to the protocol negotiation issue.
Final Words
In this article we learned how to run Wireshark and capture packets. From there we learned how to investigate the TCP 3-way handshake and a TLS negotiation. In real world scenarios, this will at least help you weed out these two types of issues.
This article builds upon the Running Google App Engine Behind Cloudflare article. Based on that article we have a default service for static content. In Google App Engine, there is only one instance of GAE per project. We can however have multiple services. All of the above is fairly trivial but this article is nuanced with using custom domains.
The Google Docs have various automatic routing that is supposed to work but does not quite seem to work properly. In all fairness, the documentation indicates custom domains only work on http not https. With that said, I could not even get it to work properly without configuring a dispatch.
Configuring Custom Domain
From the last article, we configured www-test.woohoosvcs.com previously but we will walk through it again.
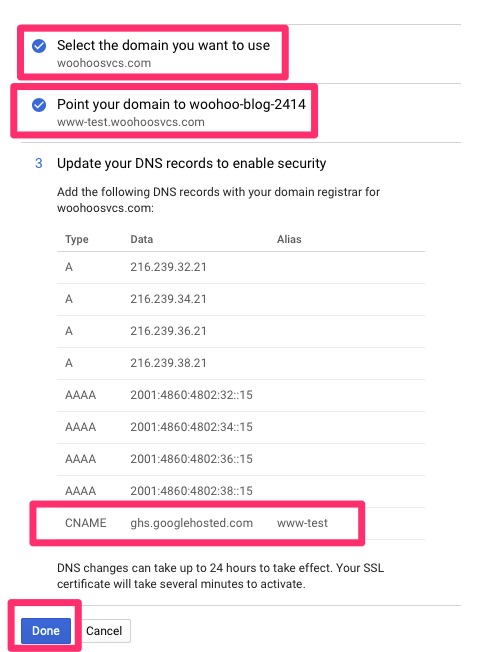
We want to “Add” a custom domain. Walk through the normal setup and in this case it was “www-test.woohoosvcs.com”. DNS records were already in place but it lists the CNAME that should be put in place.
This time we were able to select the domain name and click “disable managed security” to stop that process.
Then flip over to SSL certificates and assign the wildcard to this domain. If you get tired of doing this you can assign a “*.woohoosvcs.com” domain but don’t delete the “wooohoosvcs.com” if you do.
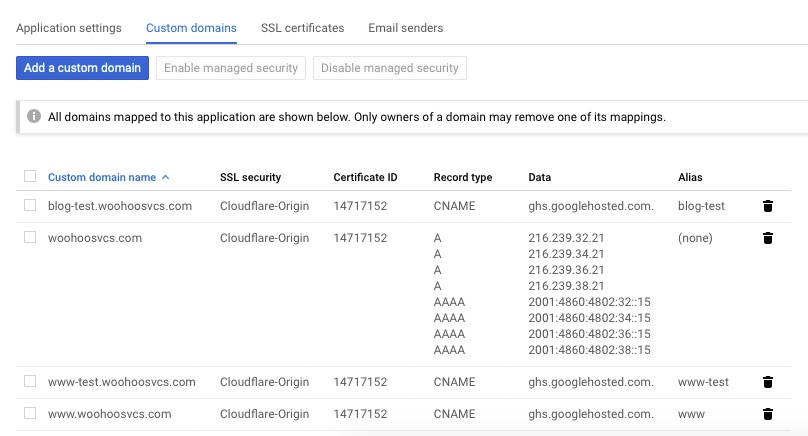
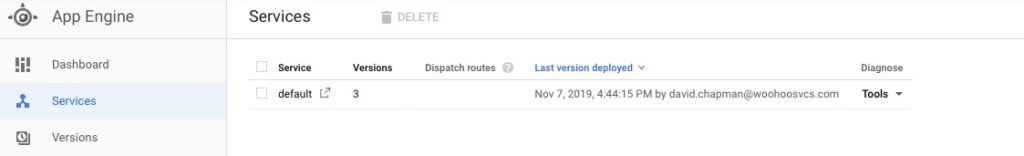
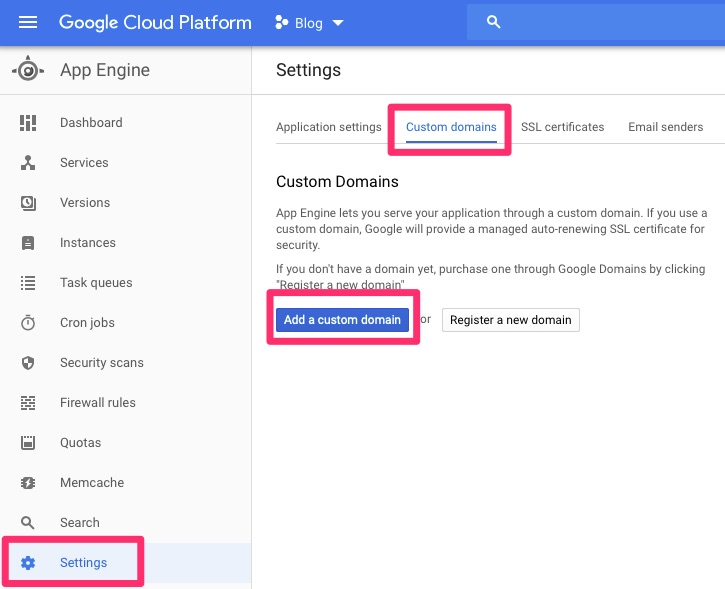
Google App Engine – Custom domains
Service Routing
Google has quite a few documents I will list below on how it “should work”. And maybe I just had bad luck. I played with it for a good hour and came to the conclusion that I had to use a dispatch for custom domains.
Please keep in mind, you must already have a default service to create a non default. We have done that in the previous article.
www-test is fairly simple. The structure is flat. Create a directory “www-test.woohoosvcs.com” and create the following files
index.php
<html>
  <head>
    <title>Hello World from Google App Engine in PHP</title>
  </head>
    <body>
    <h1>Hello World from Google App Engine in PHP!</h1>
    <p>
     <? echo "This output is in php!" ?>
    </p>
  </body>
</html>
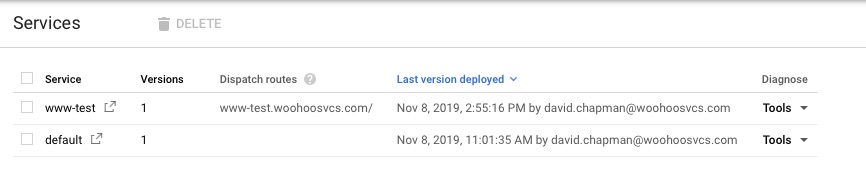
You can see the default as well as www-test with a dispatch route.
Testing!
Now I pull up https://www-test.woohoosvs.com and expect my php page but I am sadly displeased. My default service responds. This is where I was for about an hour. Even the dispatch was giving me strange results until I loaded it up in curl and checked the headers
For static pages like the default, Google App Engine appears to cache the results. The dynamic pages like php do not appear to have cache (as expected).
I was able to hit another google app engine front end that did not cache the results to test and it worked
By the time I checked it again with the browser the cache had cleared and it was working as expected.
Final Words
Google App Engine is fairly flexible but it does have some nuances when trying to use custom domain names. If you are thinking about deploying something more complex outside of the default service, please do your testing ahead of time.
In my article Running Google App Engine Behind Cloudflare, the goal is to get to a point where horizontal scaling can happen. One of the final barriers is the location of the images. WordPress stores the images in wp-content on the local machine.
Horizontal Scaling
Once this is separated the WordPress site can be somewhat easily horizontally scaled. There are a few methods that can be used to achieve this, particularly in Google Cloud.
We could spin up more VMs and point them to the database
Load the WordPress Docker image into a Kubernetes Cluster
Run WordPress in Google App Engine
The actual method of horizontal scaling is out of scope for this document but this is the last barrier to get you to that decision.
References
I am going to give credit where it is due up front. Google’s tutorial on running WordPress on Google App Engine was a good starting point but not the first article I came across on this.
I came across this article from Kinsta which has some pretty good directions on a tool that looks extremely promising.
Storage Plugins
With anything WordPress, there is a plugin for it! Here are some options. We will choose one of these for this article.
WP Offload Media – This one seems to have been around the longest but it will cost you to migrate existing content
WP-Stateless – Seems extremely promising. This shows up 3rd on the list but is the one we will implement in this article.
Preparation
For this article I decided it probably is not a good idea to make intrusive changes to this blog in order to generate more content. For this reason I decided to clone the production into staging.
Also, make sure to kick off a snapshot and backup of the database and VM beforehand.
Install WP-Stateless
We need to install and activate the WP-Stateless plugin.
Create Storage Bucket
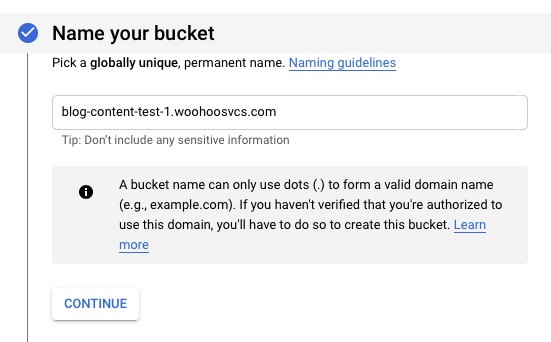
WP-Stateless will guide you through creating the bucket but I wanted to do that manually to walk through the options. In the Storage / Browser section click “Create Bucket”. I had every intention of using a custom domain name but it does not appears to be supported according to Google.
With Cloudflare since I have it set to strict, it is expecting an origin cert. If I were to downgrade the site to flexible it would connect over 80 and likely work. This is a little bit concerning because Cloudflare’s CDN is great and this now bypasses it.
“Note: You can use a CNAME redirect only with HTTP, not with HTTPS. To serve your content through a custom domain over SSL, you can set up a load balancer.”
Name Bucket – use fully qualified domain name to help future proof but not required.
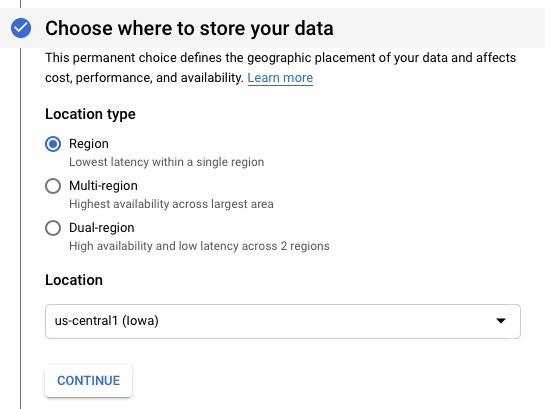
This is my lab so I chose the cheapest option but since we cannot use behind a secure CloudFlare, you may opt for multi-region. Google Storage is not a full CDN but there are tools you can layer on top of it for that.
Select Region
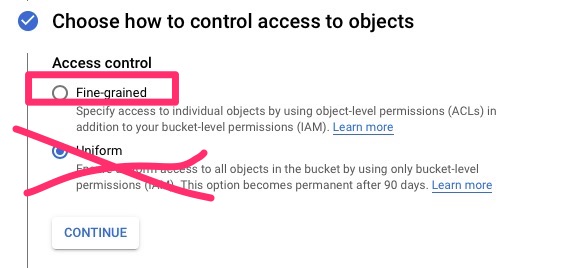
Next we will set up the ACLs. This is a mistake I made during the initial setup assuming there were no ACLs. The result was that the sync would claim to work but nothing would actually happen. I left this to show the config mistake.
Select Fine-grained
Configure WP-Stateless
It then runs you through a nice wizard. You can do a manual run as well. If you go that route, WP-Stateless’s instructions are fairly complete.
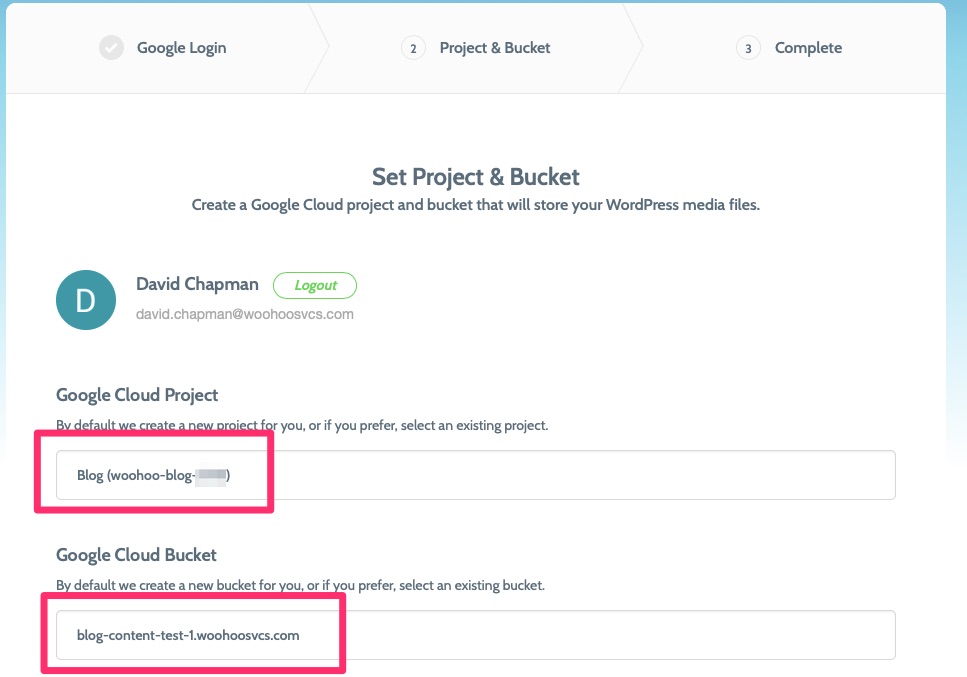
the first step asks you to login and it generates a json file for you so that it can authenticate.
Select your Project and Bucket
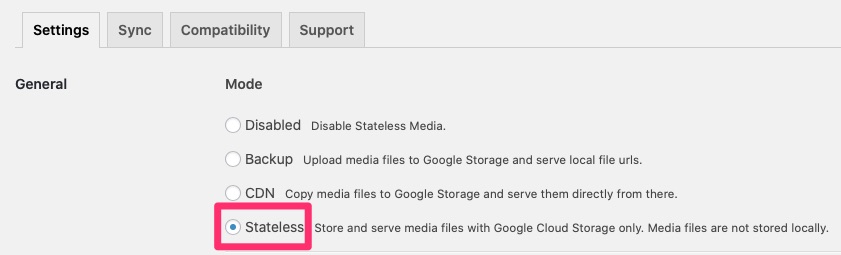
In the configuration we need to set a few options. Namely stateless.
Settings / General / Stateless
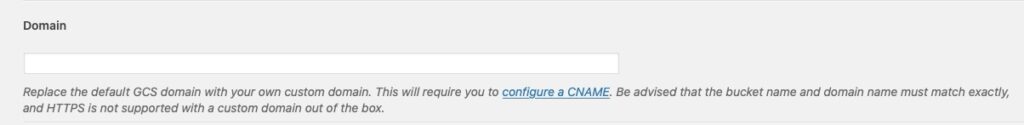
Due to the SSL issue we will leave domain blank. There is currently nowhere to upload the origin cert so a CNAME uses the A record’s SSL cert and would cause a cert mismatch. Being in strict mode, this won’t work but it may work in “full” or “flexible” since Cloudflare does not validate the cert in one case or use it in the other. If you are in “Full” or lower, give it a shot though!
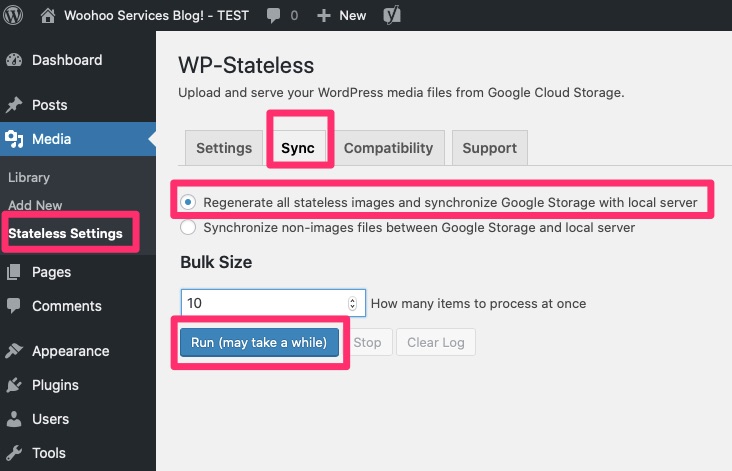
Run a sync and you’re off!
Initially I was running on a micro instance with under 1GB RAM and it locked up and ran out of RAM. The default Bulk size is 1, you may need to go closer to 1. I re-ran this on a 1.7GB instance and ran with 1 and had no issues.
Some of these images did not have proper permissions. Since I manually synced the filesystems for this staging environment some of the newer images had incorrect permissions.
Here we have used a free plugin to move our images to a shared and central repository. Due to my configuration and desire to keep it, it does not leverage Cloudflare’s CDN but you are able to make your own decision on that.
UPDATE: 20191109 – I can confirm lowering Cloudflare security to Full and adding the CNAME to c.storage.googleapis.com does allow this to work. It would be a decision point at the time of needing this whether I go that route.
At this point, at least in this test environment, I could spin up multiple front ends now to handle any excess of traffic.
Another benefit of this is it helps keep your VM light without having to store all of your images on it.
I had the need of a fairly static site in my infrastructure ecosystem. I thought, why not write an article about it with the nuance of putting it behind Cloudflare. There are much easier solutions for this static site, including running it off my WordPress server. In any case, this makes a neat introduction to Google App Engine.
% pwd
/Users/dwcjr

% curl -O https://dl.google.com/dl/cloudsdk/channels/rapid/downloads/google-cloud-sdk-270.0.0-darwin-x86_64.tar.gz

% tar xzf google-cloud-sdk-270.0.0-darwin-x86_64.tar.gz

% ./google-cloud-sdk/install.sh
Welcome to the Google Cloud SDK!
....

# We want to install this because our static site will be PHP based
% ./google-cloud-sdk/bin/gcloud components install app-engine-php

% ./google-cloud-sdk/bin/gcloud init
....
You are logged in as: [[email protected]].

Pick cloud project to use:
 [1] woohoo-blog-2414
 [2] Create a new project
Please enter numeric choice or text value (must exactly match list
item):  1
...
Deploying the App
Here I setup a www structure as per the Google article.
We need to make sure www/index.html exists. Make a simple hello world in it. Something like the following would suffice
<html>
  <head>
    <title>Hello, world!</title>
  </head>
  <body>
    <h1>Hello, world!</h1>
    <p>
      This is a simple static HTML file that will be served from Google App
      Engine.
    </p>
  </body>
</html>
It produces a bit of output but a few minutes later, the app is deployed
% gcloud app deploy
Services to deploy:

descriptor:      [/Users/dwcjr/Downloads/woohoosvcs.com/app.yaml]
source:          [/Users/dwcjr/Downloads/woohoosvcs.com]
target project:  [woohoo-blog-2414]
target service:  [default]
target version:  [20191107t164351]
target url:      [https://woohoo-blog-2414.appspot.com]


Do you want to continue (Y/n)?  Y

Beginning deployment of service [default]...
Default Service Deployed
Custom Hostnames
This is where some trickery happens. Not really, it is fairly straight forward, particularly with Cloudflare. We need to navigate to Settings / Custom Domains and add one. We will use www-test.woohoosvcs.com for this demo.
GAE / Settings / Custom Domains / AddWalk through the setup with your domains
We then need to hop over to Cloudflare and add the CNAME as requested. Make sure it is setup as a “DNS only”. We do this so Google can validate the domain for its managed certificate. We do not want to use it but it will not allow us to place a custom one otherwise.
www-test CNAME – DNS only
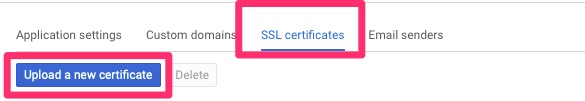
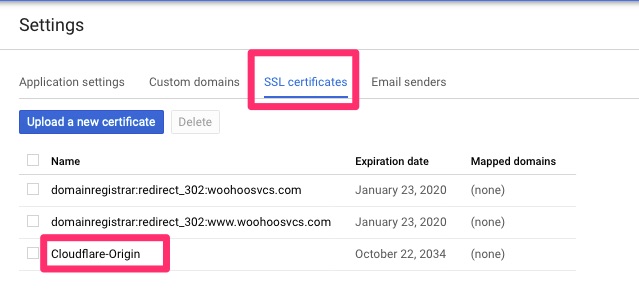
We are then going to hop on over to GAE’s Certificates section
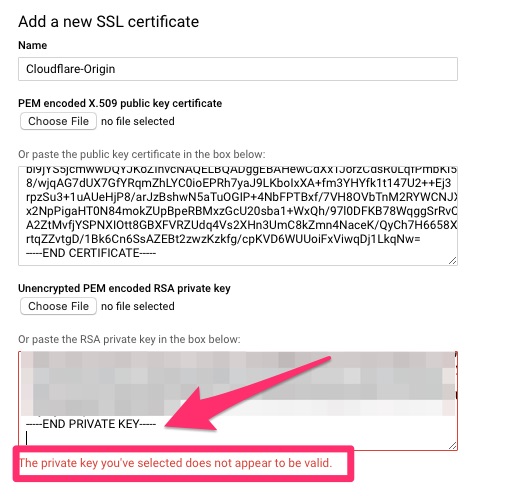
I will then upload my stored copy from the WordPress site. After doing so an interesting issue happened.
“The private key you’ve selected does not appear to be valid.”
This ended up being “XXX PRIVATE KEY” not being “XXX RSA PRIVATE KEY” so I simply modified the BEGIN and END to have RSA and it went through!
We then want to hop back over to Custom Names and disable managed security. This auto generates a certificate and we will be using the origin certificate instead.
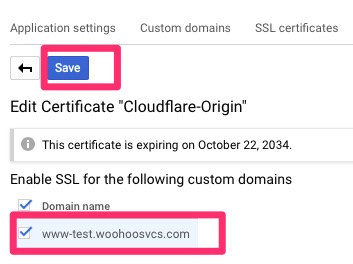
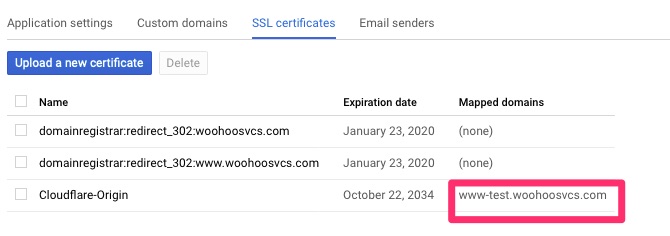
Now if we click back on SSL Certificates it will allow us to drill into Cloudflare-Origin and assign.
SSL certificates – Cloudflare-OriginSave!
We can then set the www-test.woohoosvcs.com back to Proxy to protect it
www-test / Proxied
The Test!
We can test with curl to make sure it is going through Cloudflare.
It may be a convoluted way but we now have a hosted static site behind Cloudflare using Strict TLS. All of that running on Google App Engine
In this article for the Custom Hostname, it should be possible to disable managed security so that www-test.woohoosvcs.com could start out as a Proxied entry and then associate the certificate. I had issues with that but it could have been me rebuilding the environment too quickly for the lab I was doing.
From my previous article How I Stood Up WordPress In a Day, we stood up a “Quick and Dirty” version. It was a fast and easy setup but an all in one. What happens if your WordPress site really takes off? This is not highly scalable as it is limited to the resources of the box. Perhaps your hosting provider lets you increase the size of the VM.
Scaling WordPress
Eventually you will get to a point where you reach the max. This is called vertical scaling. It is one of the easier methods but only gets so far and leads to monolithic infrastructures.
We need to be able to horizontally scale but adding highly redundant nodes. The database is the first piece of this. Since we implemented in Google Cloud, we will be using their managed SQL instance. In AWS this is called RDS.
Another issue we do not yet address is the fact that images are stored locally on the WordPress server itself. We will address that later on and provide a link to that article. Here is our article on that – Moving WordPress Images To Google Storage.
With that said, removing MySQL server from the WordPress server does leave more resources for the WordPress server itself.
Backup
Always run a backup before a major change. In this case we use Google Disk Snapshots for our Google VM and took one before.
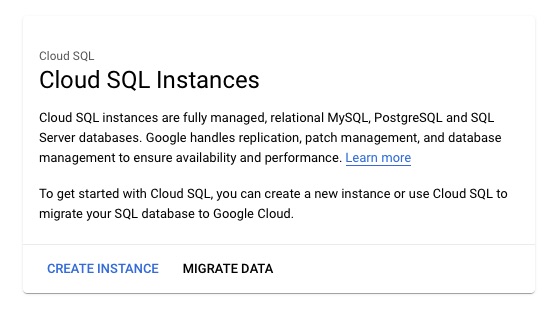
Provisioning Google MySQL
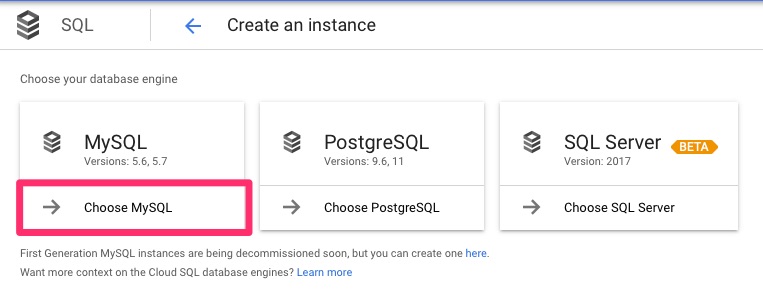
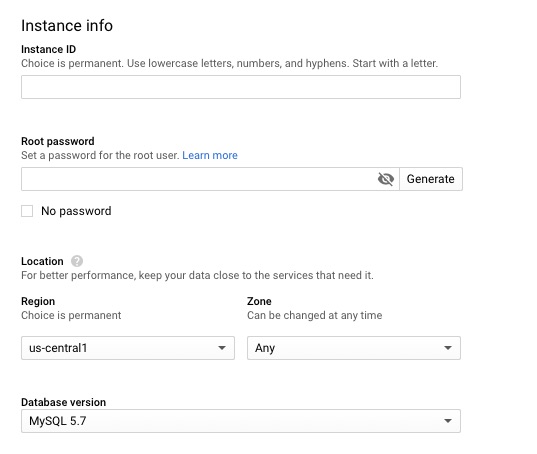
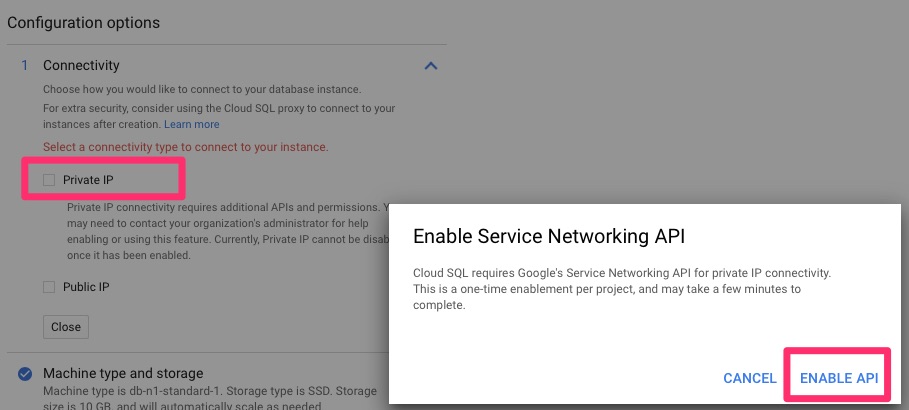
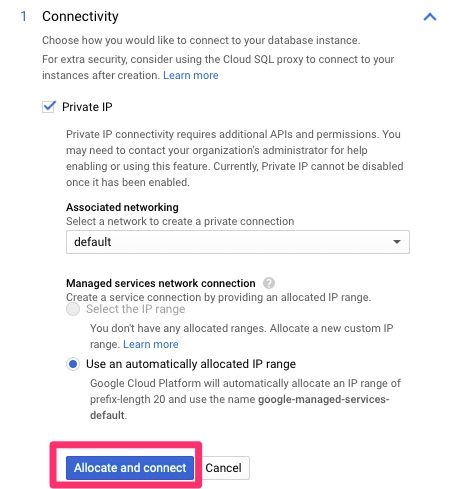
For this, we opted the “create” method. Google does have the “migrate” option which involves adding the new instance as a read replica. This is a small WordPress site so we will simply create a backup and restore it and go from there.
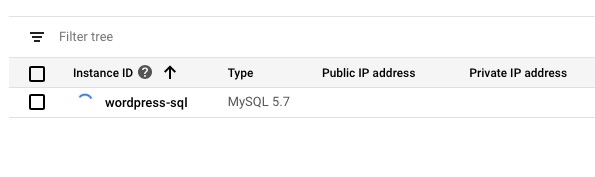
Create InstanceChoose MySQLSet instance information, passwords, etc.Enable Private IP and APIAllocate and connectWe are provisioningTutorial if you wish. This is a tutorial only.
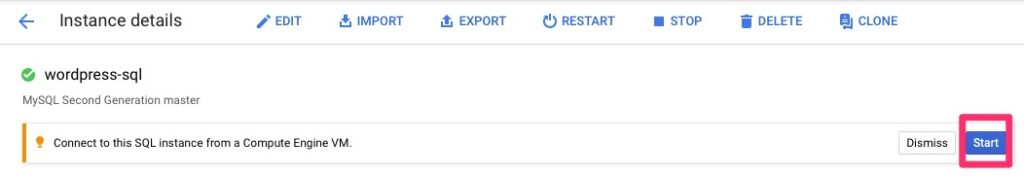
Connecting to Google MySQL Instance
Here we will connect from the VM to the instance as root. You can see the Server version includes “Google”. We will then create the wordpress database and access. This is not the most secure of GRANT but we are copying what was there. It can be locked down based on best practices. The CREATE options will be highly dependent on your existing setup and we’ll talk about it further in the troubleshooting options
$ mysql -h 10.30.128.3 -u root -p
Enter password:
Welcome to the MySQL monitor.  Commands end with ; or \g.
Your MySQL connection id is 50
Server version: 5.7.14-google-log (Google)

Copyright (c) 2000, 2019, Oracle and/or its affiliates. All rights reserved.

Oracle is a registered trademark of Oracle Corporation and/or its
affiliates. Other names may be trademarks of their respective
owners.

Type 'help;' or '\h' for help. Type '\c' to clear the current input statement.

mysql> CREATE DATABASE wordpress CHARACTER SET latin1 COLLATE latin1_swedish_ci;
mysql> GRANT ALL PRIVILEGES ON wordpress.* TO "wordpress"@"%" IDENTIFIED BY "XXXXXXXXXX";

mysql> FLUSH PRIVILEGES;

mysql> quit;
Now we need to backup the existing wordpress database
$ mysql -h 10.30.128.3 -u wordpress -p wordpress < 20191107-wordpress.sql
Enter password:
$
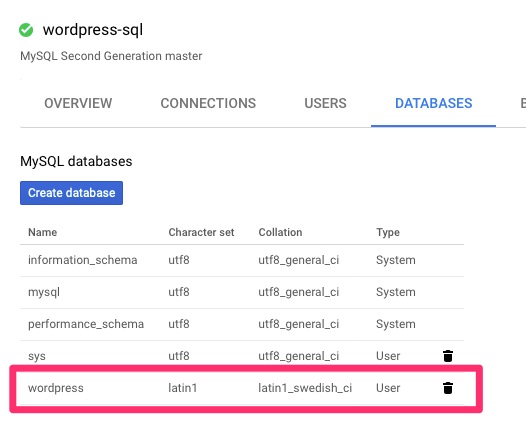
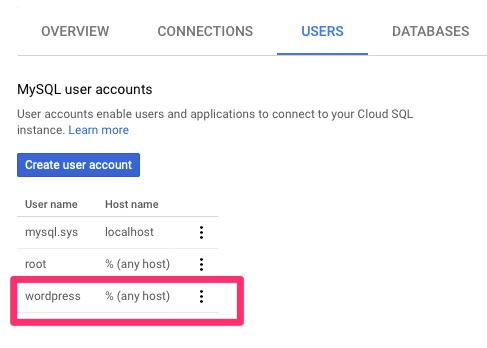
Validation
In the Google console we can then validate this.
wordpress databasewordpress user
WordPress Config
We need to modify wp-config.php as follows. If your user and password changed, those need to be updated as well.
// ** MySQL settings - You can get this info from your web host ** //
/** The name of the database for WordPress */
define( 'DB_NAME', 'wordpress' );

/** MySQL database username */
define( 'DB_USER', 'wordpress' );

/** MySQL database password */
define( 'DB_PASSWORD', 'XXXXXX' );

/** MySQL hostname */
#define( 'DB_HOST', 'localhost' );
define( 'DB_HOST', '10.30.128.3' );
Testing
Once you save the changes go to your WordPress site and test. If you get an install.php page, stop right there and back out the change. We have some troubleshooting steps below.
Backup Again!
If validation is successful, run a backup again, both in for the Google disk snapshot for the VM and in the Google MySQL instance. This way we have a known good immediately following the migration.
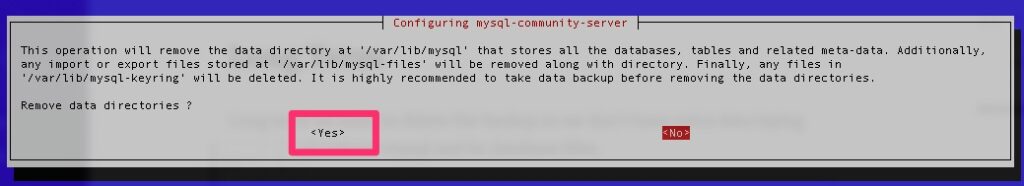
It is highly recommended to backup before you perform any of the short or long term decommission.
Troubleshooting
There are a few causes to get redirected to the install.php page
Incorrect database settings, including host, user, password, database name and table prefixes
Collation/Characterset – case insensitive versus sensitive
The others can be wrapped up into database connectivity. We tested this by connecting as the wordpress user and importing as that user after the database was connected.
Decomissioning old database
At each of these steps it is important to test the site to ensure it doesn’t break. If you are still somehow pointing to your local mysql instance, it can break. You will definitely find that out during these steps.
Short Term
We do not want old mysql data laying around so the first steps to complete afterwards are to disable and shutdown mysql. This also helps us confirm we are using the new MySQL instance.
$ sudo systemctl stop mysql
$ sudo systemctl disable mysql
Synchronizing state of mysql.service with SysV service script with /lib/systemd/systemd-sysv-install.
Executing: /lib/systemd/systemd-sysv-install disable mysql
Removed /etc/systemd/system/multi-user.target.wants/mysql.service.
Long Term
Long term we want to delete the backup so we don’t have extra data laying around and remove mysql and its database files.
At this point we have accomplished scaling to a potentially highly available database. This database also can be dynamically sized to accommodate extra load. For the sake of this article, we chose the smallest size possible due to the current load. Should this go viral though, the database can easily be scaled.
The Rancher ecosystem is an umbrella of tools. We will specifically be talking about the Rancher product or sometimes referred to as Rancher Server. Rancher is an excellent tool for managing and monitoring your Kubernetes cluster, no matter where it exists.
Requirements and Setup
The base requirement is just a machine that has docker. For the sake of this article, we will use their RancherOS to deploy.
RancherOS touts itself at being the lightest weight OS capable of running docker. All of the system services have been containerized as well. The most difficult part of installing “ros” is using the cloud-init.yaml to push your keys to it!
We will need the installation media as can be found here
The minimum requirements state 1GB of RAM but I had issues with that and bumped my VM up to 1.5GB. It was also provisioned with 1 CPU Core and 4GB HDD.
A cloud-config.yml should be provisioned with your ssh public key
We also assume you will be picking up from the Intro to Kubernetes article and importing that cluster.
Installing RacherOS
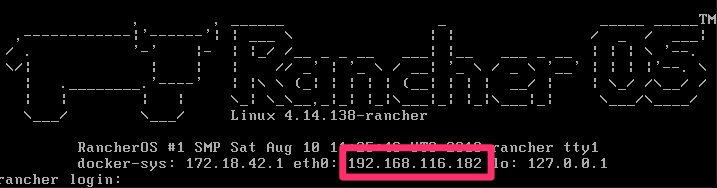
Autologin prompt on rancheros
On my laptop I ran the following command in the same directory that I have the cloud-config.yml. This is a neat way to have a quick and dirty web server on your machine.
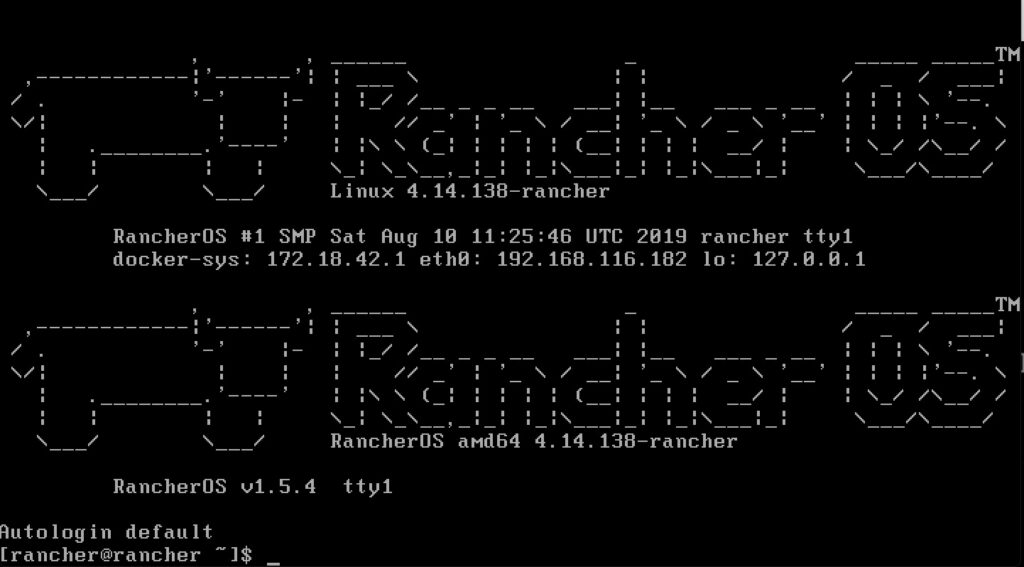
A few prompts including a reboot and you will be asking yourself if it was just that easy? When it boots up, it shows you the IP to make it that much easier to remotely connect. Afterall, you are only enabled for ssh key auth at this point and cannot really login at the console.
Rancher Second Boot
 % ssh [email protected]
The authenticity of host '192.168.116.182 (192.168.116.182)' can't be established.
ECDSA key fingerprint is SHA256:KGTRt8HZu1P4VFp54vOAxf89iCFZ3jgtmdH8Zz1nPOA.
Are you sure you want to continue connecting (yes/no)? yes
Warning: Permanently added '192.168.116.182' (ECDSA) to the list of known hosts.
Enter passphrase for key '/Users/dwcjr/.ssh/id_rsa':
[rancher@rancher ~]$
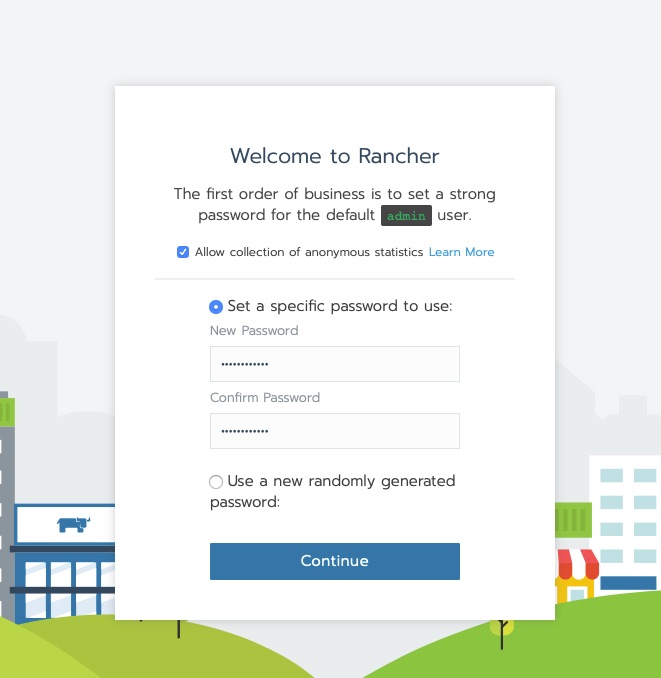
Connect via HTTPS to the rancher server and you’ll get the new user creation for admin
Welcome to Rancher!
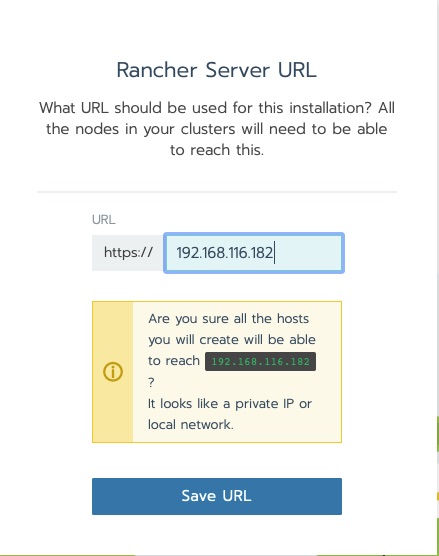
The next question is an important design decision. The Kubernetes nodes that this will be managing need to be able to connect to the rancher host. the reason being is agents are deployed that phone home. The warning in this next message is ok for this lab.
Rancher Server URL
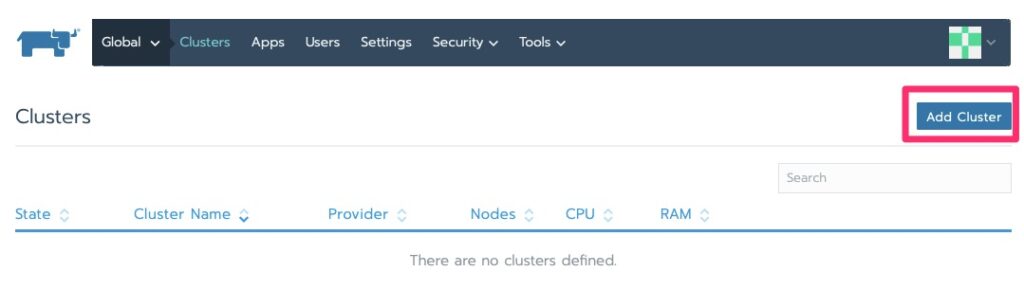
Importing a Cluster
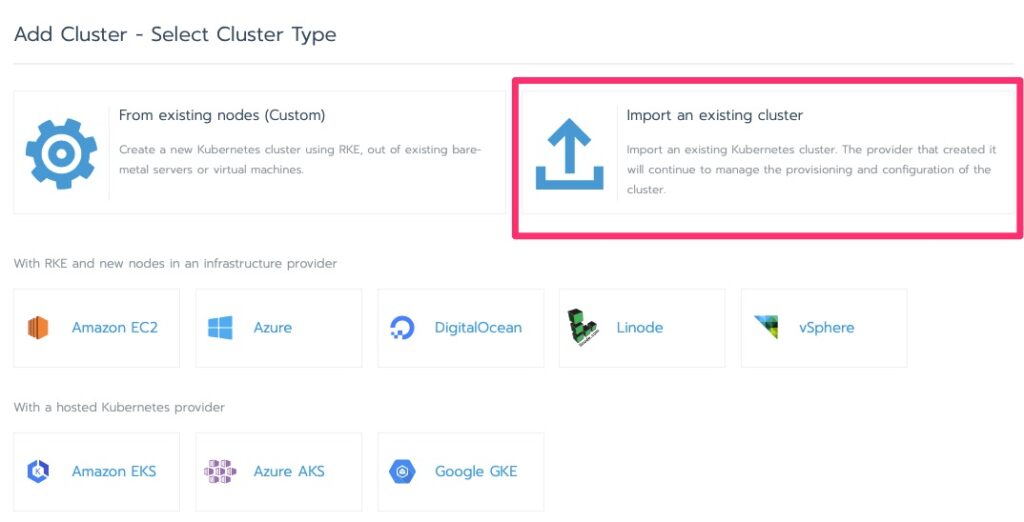
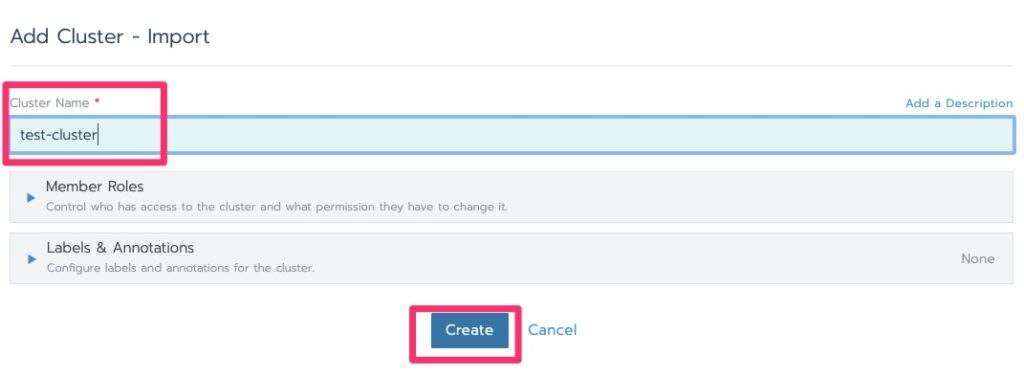
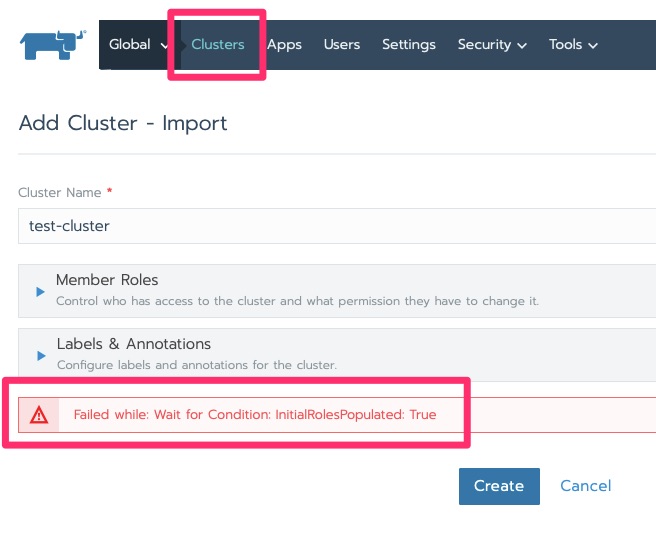
Add ClusterImport Existing Cluster
In this lab I have been getting the following error but click over to clusters and it moves on with initializing.
Failed while: Wait for Condition: InitialRolesPopulated: True
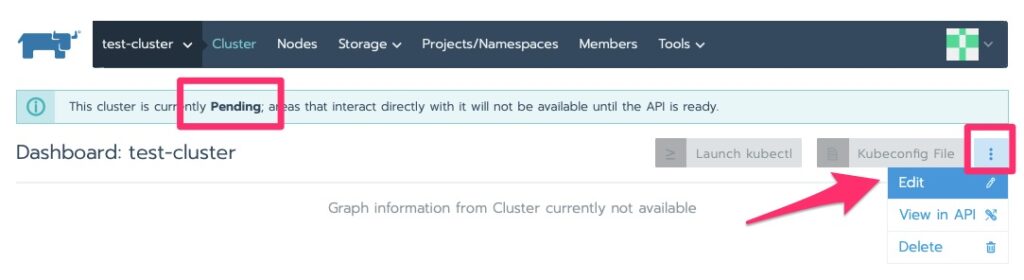
It will stay in initializing for a little bit. Particularly in this lab with minimal resources. We are waiting for “Pending”.
Now that it is pending we can edit it for the kubectl command to run on the nodes to deploy the agent
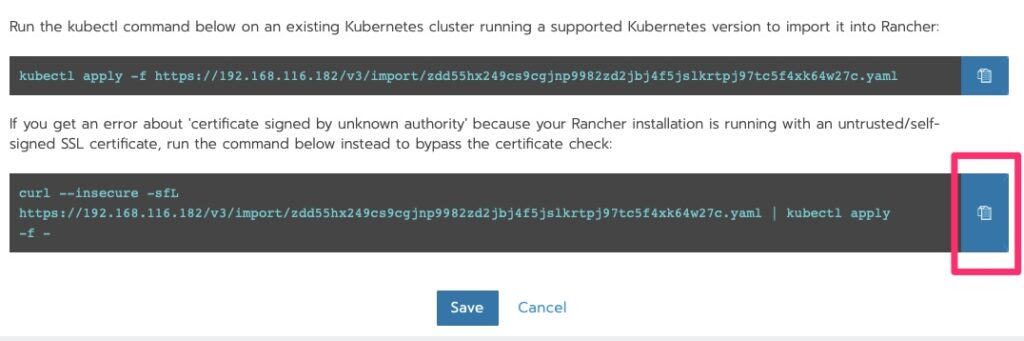
Pending is good. Now we want to edit.Copy the bottom option to the clipboard since we used a self-signed cert that the Kubernetes cluster does not trust.
Deploying the Agent
Run the curl!
root@kube-master [ ~ ]# curl --insecure -sfL https://192.168.116.182/v3/import/zdd55hx249cs9cgjnp9982zd2jbj4f5jslkrtpj97tc5f4xk64w27c.yaml | kubectl apply -f -
clusterrole.rbac.authorization.k8s.io/proxy-clusterrole-kubeapiserver created
clusterrolebinding.rbac.authorization.k8s.io/proxy-role-binding-kubernetes-master created
namespace/cattle-system created
serviceaccount/cattle created
clusterrolebinding.rbac.authorization.k8s.io/cattle-admin-binding created
secret/cattle-credentials-79f50bc created
clusterrole.rbac.authorization.k8s.io/cattle-admin created
deployment.apps/cattle-cluster-agent created
The DaemonSet "cattle-node-agent" is invalid: spec.template.spec.containers[0].securityContext.privileged: Forbidden: disallowed by cluster policy
Boo – what is “disallowed by cluster policy”? This is a permission issue
On Kubernetes 1.14 you can set “–allow-privileged=true” on the apiserver and kubelet. It is deprecated in higher versions. Make that change on our 1.14 cluster and we’re off to the races!
Slow races but we’re off. Give it a good few minutes to make some progress. While we wait for this node to provision, set the “–allow-privileged=true” on the other nodes in /etc/kubernetes/kubelet
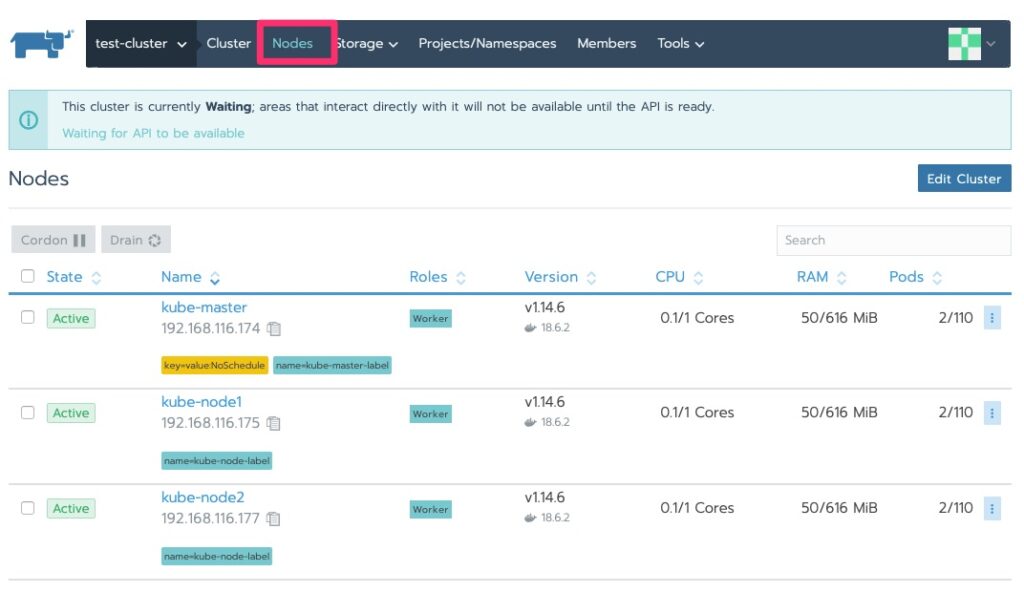
We should now see some nodes and the status has changed to “waiting” and we will do just that. By now, if you haven’t realized, Kubernetes is not “fast” on the provisioning. Well at least in these labs with minimal resources 🙂
Cluster Status Waiting and nodes exist.
Checking on the status I ran into this. My first thought was RAM on the master node. I have run into this enough before.
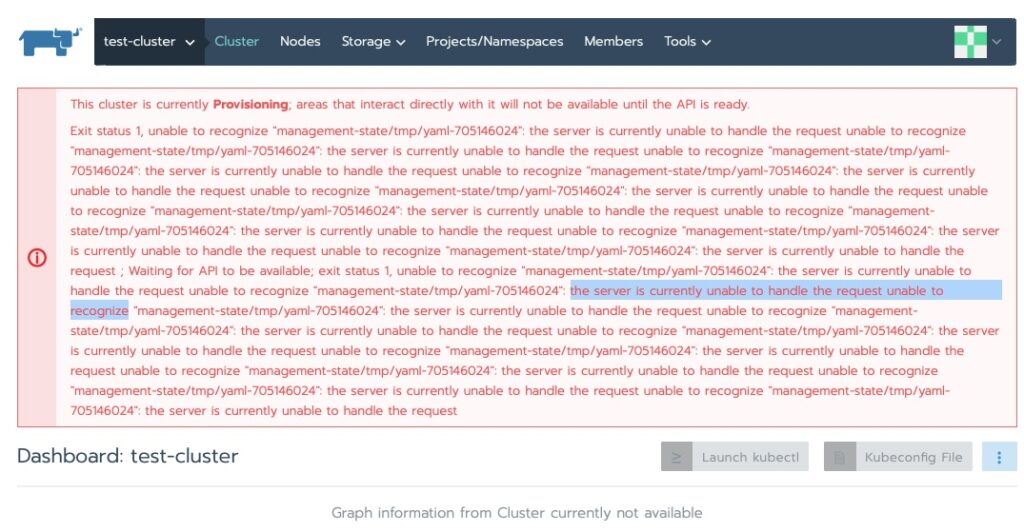
This cluster is currently Provisioning; areas that interact directly with it will not be available until the API is ready. Exit status 1, unable to recognize “management-state/tmp/yaml-705146024”: the server is currently unable to handle the request unable to recognize “management-state/tmp/yaml-705146024”
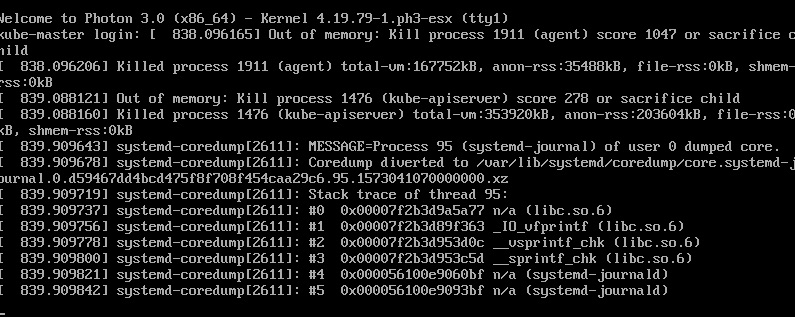
Sure enough, running top and checking the console confirmed that.
kube-master out of ram. Time to increase a little to cover the overhead of the agent. Went from 768MB to 1024MB and back up and at ’em!
It did sit at the following error for some time.
This cluster is currently Provisioning; areas that interact directly with it will not be available until the API is ready.
Exit status 1, unable to recognize "management-statefile_path_redacted":
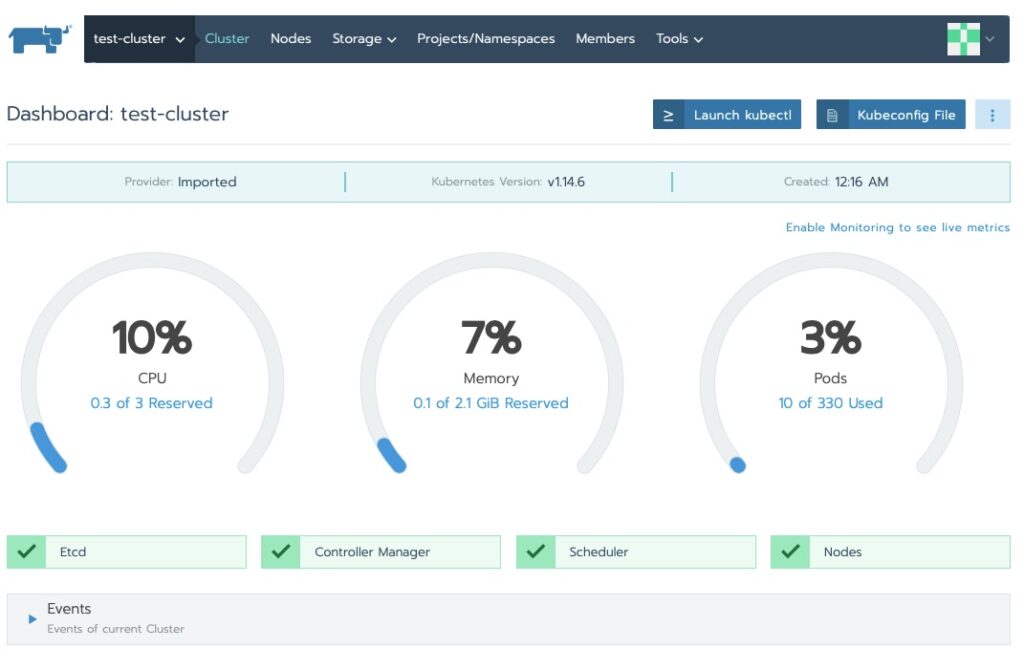
Some indications show this eventually resolves itself. Others have indicated adding a node helps kick off the provisioning to continue. In my case a good 10 minutes and we’re all green now!
Rancher Cluster Dashboard
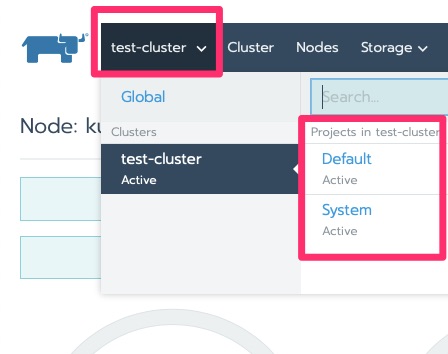
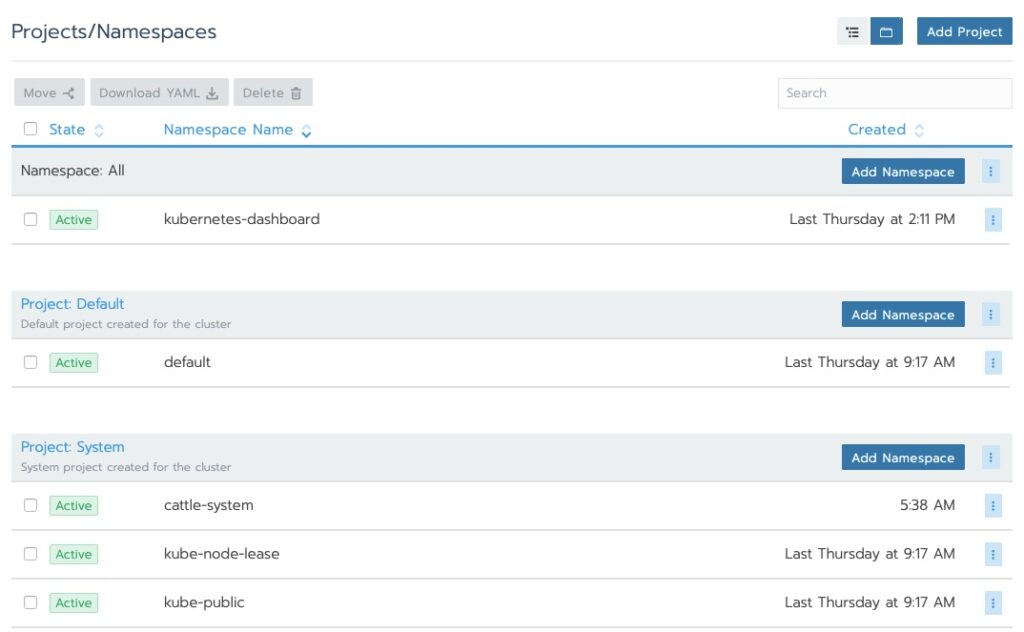
Navigating Around
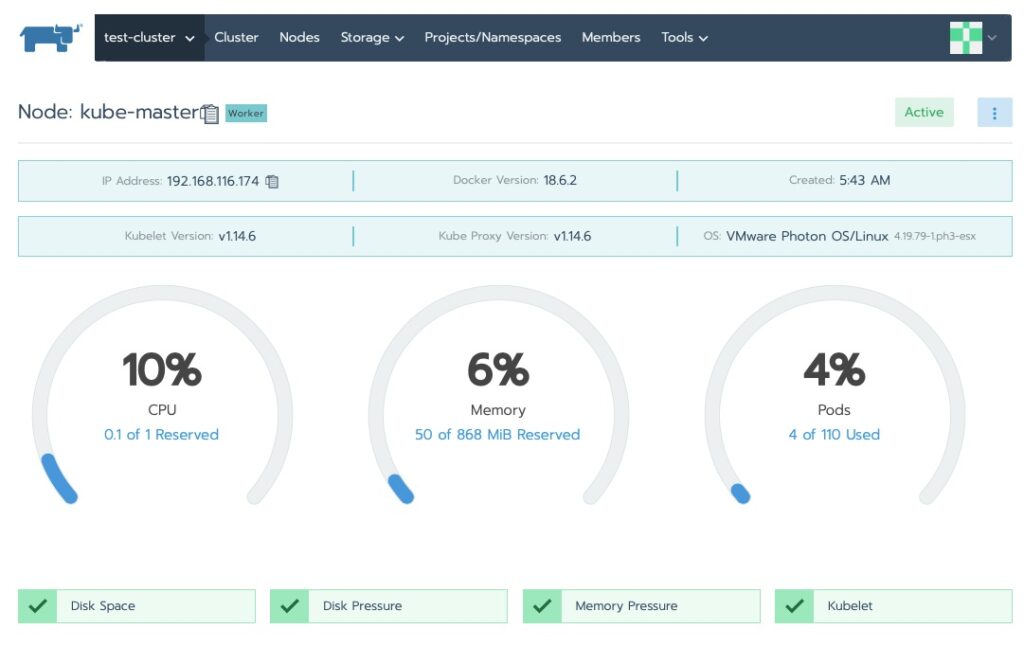
We saw the cluster area. Let’s drill into the nodes!
Rancher Dashboard NodesRancher partitions the clusters into System and Default. This is a carryover from “ros” which does the same to the OS.Rancher Projects and Namespaces
Final Words
Rancher extends the functionality of Kubernetes, even on distributions of Kubernetes that are not Rancher. Those extensions are beyond the scope of this article. At the end of this article though you have a single node Rancher management tool that can manage multiple clusters. We did so with RancherOS. Should you want to do this in production it is recommended to have a “management” Kubernetes cluster to make rancher highly available and use a certificate truted by Kubernetes, from the trusted CA cert.
When shutting down this lab, I saw that the kube-node1/2 ran out of memory and I had to increase them to 1GB as well for future boots to help avoid this.
Network Configuration management is many times overlooked. Better yet, companies with strong Change Management practices believe they do not need config management because of this.
The issue is that sometimes commands entered to network gear do not take effect as we expect or we want to compare history and easily diff changes for root cause analysis.
Rancid
Rancid is a free open source tool to handle just this. I have successfully used it for the past few years. It has been a great tool and caught a typo from time to time as well as unexpected application of commands.
At a high level, the way it works is to pull a full config each time and push it into a version control system like CVS or Subversion. Git is also a popular choice but not really necessary as we will not be branching.
Once the configs are pumped into a versioning system, it is easy to produce diffs and any time rancid runs, it outputs the diffs so you can see the change.
The initial setup of rancid is often a barrier to entry. Once you get it setup the first time, upgrades are fairly simple.
Installing
For this demo, we are using a VM. We installed a minimal install CentOS 8.0 on a 1GB RAM, 10GB HDD with 1 CPU core. Production specs are not much more than this depending on how many devices you are querying and how often.
We need to install some dependencies! Expect is the brains of rancid and used to send and receive data from the network devices. Many of the modules that manipulate the data received are perl. Gcc and make are used to build the source code.
We need some sort of mailer, hence sendmail. You can use postfix if you prefer that.
We will be using CVS for simplicity and the default configuration of rancid.
[root@rancid ~]# tar xzf rancid-3.10.tar.gz

[root@rancid ~]# ls -la | grep rancid
drwxr-xr-x.  8 7053 wheel   4096 Sep 30 18:15 rancid-3.10
-rw-r--r--.  1 root root  533821 Nov  5 06:13 rancid-3.10.tar.gz

[root@rancid ~]# cd rancid-3.10


[root@rancid ~]# ./configure
checking for a BSD-compatible install... /usr/bin/install -c
checking whether build environment is sane... yes
checking for a thread-safe mkdir -p... /usr/bin/mkdir -p
checking for gawk... gawk
.....
config.status: creating include/config.h
config.status: executing depfiles commands

[root@rancid rancid-3.10]# make
... tons of output
gmake[1]: Leaving directory '/root/rancid-3.10/share'

[root@rancid rancid-3.10]# make install

[root@rancid rancid-3.10]# ls -la /usr/local/rancid/
total 4
drwxr-xr-x.  7 root root   63 Nov  5 06:21 .
drwxr-xr-x. 13 root root  145 Nov  5 06:20 ..
drwxr-xr-x.  2 root root 4096 Nov  5 06:21 bin
drwxr-xr-x.  2 root root   90 Nov  5 06:21 etc
drwxr-xr-x.  3 root root   20 Nov  5 06:21 lib
drwxr-xr-x.  4 root root   31 Nov  5 06:21 share
drwxr-xr-x.  2 root root    6 Nov  5 06:20 var
We very likely do not want this to run as root so we will need to create a user. By default, rancid gets installed to /usr/local/rancid so we will set that to the user’s home directory
Well that was anticlimactic. Rancid typically doesn’t output at the console and reserves that for the logs in ~/var/logs
[rancid@rancid logs]$ pwd
/usr/local/rancid/var/logs
[rancid@rancid logs]$ ls -altrh
total 4.0K
drwxr-xr-x. 3 rancid rancid 35 Nov 5 07:00 ..
-rw-r-----. 1 rancid rancid 270 Nov 5 07:00 networking.20191105.070023
drwxr-x---. 2 rancid rancid 40 Nov 5 07:00 .
[rancid@rancid logs]$ cat networking.20191105.070023
starting: Tue Nov 5 07:00:23 CST 2019
/usr/local/rancid/var/networking does not exist.
Run bin/rancid-cvs networking to make all of the needed directories.
ending: Tue Nov 5 07:00:23 CST 2019
[rancid@rancid logs]$
Ok, let’s run rancid-cvs. Its nice that it will create the repos for you. It both versions the router configs and the router.db files
[rancid@rancid ~]$ ~/bin/rancid-cvs
No conflicts created by this import
cvs checkout: Updating networking
Directory /usr/local/rancid/var/CVS/networking/configs added to the repository
cvs commit: Examining configs
cvs add: scheduling file `router.db' for addition
cvs add: use 'cvs commit' to add this file permanently
RCS file: /usr/local/rancid/var/CVS/networking/router.db,v
done
Checking in router.db;
/usr/local/rancid/var/CVS/networking/router.db,v <-- router.db
initial revision: 1.1
done
# Proof of CVS creation
[rancid@rancid ~]$ find ./ -type d -name CVS
./var/CVS
./var/networking/CVS
./var/networking/configs/CVS
Rancid-run again!
[rancid@rancid ~]$ cd var/logs
[rancid@rancid logs]$ ls -altrh
total 8.0K
-rw-r-----. 1 rancid rancid 270 Nov 5 07:00 networking.20191105.070023
drwxr-xr-x. 5 rancid rancid 64 Nov 5 07:04 ..
drwxr-x---. 2 rancid rancid 74 Nov 5 07:05 .
-rw-r-----. 1 rancid rancid 741 Nov 5 07:05 networking.20191105.070555
[rancid@rancid logs]$ cat networking.20191105.070555
starting: Tue Nov 5 07:05:55 CST 2019
cvs add: scheduling file `.cvsignore' for addition
cvs add: use 'cvs commit' to add this file permanently
cvs add: scheduling file `configs/.cvsignore' for addition
cvs add: use 'cvs commit' to add this file permanently
cvs commit: Examining .
cvs commit: Examining configs
RCS file: /usr/local/rancid/var/CVS/networking/.cvsignore,v
done
Checking in .cvsignore;
/usr/local/rancid/var/CVS/networking/.cvsignore,v <-- .cvsignore
initial revision: 1.1
done
RCS file: /usr/local/rancid/var/CVS/networking/configs/.cvsignore,v
done
Checking in configs/.cvsignore;
/usr/local/rancid/var/CVS/networking/configs/.cvsignore,v <-- .cvsignore
initial revision: 1.1
done
ending: Tue Nov 5 07:05:56 CST 2019
The router.db we created in ~/var/router.db needs to move to ~/var/networking/router.db
[rancid@rancid var]$ mv ~/var/router.db ~/var/networking/
[rancid@rancid var]$ ~/bin/rancid-run
[rancid@rancid var]$ cd logs
[rancid@rancid logs]$ ls -la
total 12
drwxr-x---. 2 rancid rancid 108 Nov 5 07:08 .
drwxr-xr-x. 5 rancid rancid 47 Nov 5 07:08 ..
-rw-r-----. 1 rancid rancid 270 Nov 5 07:00 networking.20191105.070023
-rw-r-----. 1 rancid rancid 741 Nov 5 07:05 networking.20191105.070555
-rw-r-----. 1 rancid rancid 1899 Nov 5 07:08 networking.20191105.070840
[rancid@rancid logs]$ cat networking.20191105.070840
starting: Tue Nov 5 07:08:40 CST 2019
/usr/local/rancid/bin/control_rancid: line 433: sendmail: command not found
cvs add: scheduling file `test-f5' for addition
cvs add: use 'cvs commit' to add this file permanently
RCS file: /usr/local/rancid/var/CVS/networking/configs/test-f5,v
done
Checking in test-f5;
/usr/local/rancid/var/CVS/networking/configs/test-f5,v <-- test-f5
initial revision: 1.1
done
Added test-f5
Trying to get all of the configs.
test-f5: missed cmd(s): all commands
test-f5: End of run not found
test-f5 clogin error: Error: /usr/local/rancid/.cloginrc must not be world readable/writable
#
This file does have passwords afterall, let’s lock it down
I went through a few iterations of troubleshooting and looking at the logs. I did this because nearly nobody gets the install 100% correct the first time. Therefore, its great to understand how to check the logs and make changes accordingly.
The final cloginrc looks like this
[rancid@rancid ~]$ cat .cloginrc
add user test-f5	root
add password test-f5 XXXXXXXXXX
#defaults for most devices
add autoenable * 1
add method * ssh
The rancid.conf needed this line changed
SENDMAIL="/usr/sbin/sendmail"
And now we have a clean run!
[rancid@rancid ~]$ cat var/logs/networking.20191105.073209
starting: Tue Nov 5 07:32:09 CST 2019


Trying to get all of the configs.
All routers successfully completed.

cvs diff: Diffing .
cvs diff: Diffing configs
cvs commit: Examining .
cvs commit: Examining configs

ending: Tue Nov 5 07:32:20 CST 2019
Scheduled Runs
On UNIX, crontab is the typical default to run scheduled jobs and here is a good one to run. You can edit your crontab by running “crontab -e” or list it by running “crontab -l”
This crontab runs rancid 2 minutes after the hour at 02:02 and 14:02. It then clears logs older than 7 days every 24 hours at 22:58. We do not want the drive to fill up due to noisy logs.
Web Interface
Rancid is nearly 100% CLI but there are addon tools for CVS that we can use. Namely cvsweb. FreeBSD was a heavy user of CVS and created this project/package.
cvsweb will require apache and “rcs”. RCS does not yet exist in EPEL for CentOS 8.0
Wait, it still doesn’t work. Let’s check /var/log/httpd/error_log
Can't locate IPC/Run.pm in @INC (you may need to install the IPC::Run module) (@INC contains: /usr/local/lib64/perl5 /usr/local/share/perl5 /usr/lib64/perl5/vendor_perl /usr/share/perl5/vendor_perl /usr/lib64/perl5 /usr/share/perl5) at /var/www/cgi-bin/cvsweb.cgi line 100.
BEGIN failed--compilation aborted at /var/www/cgi-bin/cvsweb.cgi line 100.
[Tue Nov 05 08:02:58.091776 2019] [cgid:error] [pid 20354:tid 140030446114560] [client ::1:37398] End of script output before headers: cvsweb.cgi
Then I ran into the following issue which seems to be a known bug. I manually edited the file as recommended in the patch.
"my" variable $tmp masks earlier declaration in same statement at /var/www/cgi-bin/cvsweb.cgi line 1338.
syntax error at /var/www/cgi-bin/cvsweb.cgi line 1195, near "$v qw(hidecvsroot hidenonreadable)"
Global symbol "$v" requires explicit package name (did you forget to declare "my $v"?) at /var/www/cgi-bin/cvsweb.cgi line 1197.
Global symbol "$v" requires explicit package name (did you forget to declare "my $v"?) at /var/www/cgi-bin/cvsweb.cgi line 1197.
syntax error at /var/www/cgi-bin/cvsweb.cgi line 1276, near "}"
  (Might be a runaway multi-line << string starting on line 1267)
syntax error at /var/www/cgi-bin/cvsweb.cgi line 1289, near "}"
syntax error at /var/www/cgi-bin/cvsweb.cgi line 1295, near "}"
syntax error at /var/www/cgi-bin/cvsweb.cgi line 1302, near "}"
syntax error at /var/www/cgi-bin/cvsweb.cgi line 1312, near "}"
syntax error at /var/www/cgi-bin/cvsweb.cgi line 1336, near "}"
syntax error at /var/www/cgi-bin/cvsweb.cgi line 1338, near ""$tmp,v" }"
/var/www/cgi-bin/cvsweb.cgi has too many errors.
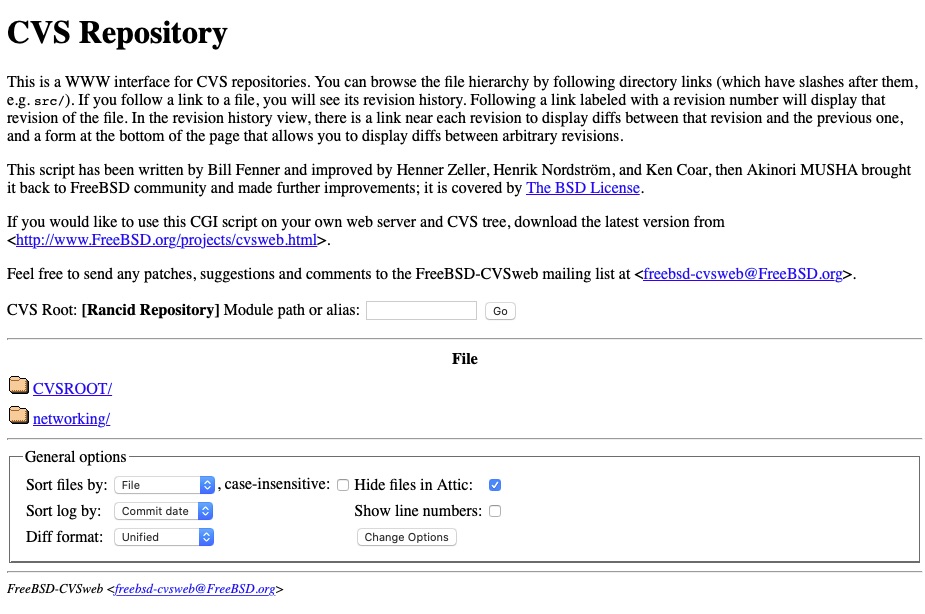
Are we there yet?
Yay – We can see the root!
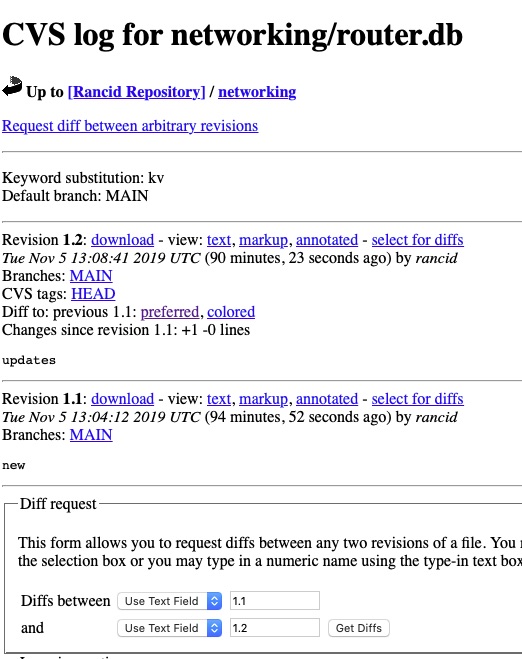
And we can drill into router.db and other areas!
Security
We really should secure this page because 1) We are running perl scripts and cgi-bin is notoriously insecure. For 2) We have router configs, possibly with passwords and passphrases.
[root@rancid ~]# htpasswd -c /etc/httpd/.htpasswd dwchapmanjr
New password:
Re-type new password:
Adding password for user dwchapmanjr
[root@rancid ~]#
We then want to Allow overrides so that the .htaccess will actually work by editing /etc/httpd/conf/httpd.conf
# Change Allow Override to All

<Directory "/var/www/cgi-bin">
    #AllowOverride None
    AllowOverride All
    Options None
    Require all granted
</Directory>
And then “systemctl restart httpd”
With any luck you should get a user/pass prompt now! It is not the most secure but it is something.
Final Words
In this article we have stood up rancid from scratch. We have also gone over some basic troubleshooting steps and configured apache and cvsweb to visually browse the files.
Hosting your company online could mean a few things to different people. The purpose of this post is to help guide new startups through hosting email, web presence and some other related tools.
About 20 years ago this was a more costly endeavor. There were fewer players and each component cost more. It has been highly commoditized and DNS Hosting is usually free these days.
This will not go into the technical details of doing it. If there is a need for that I am happy to expand on this article. This article simply describes the route to you can take.
Leading By Example
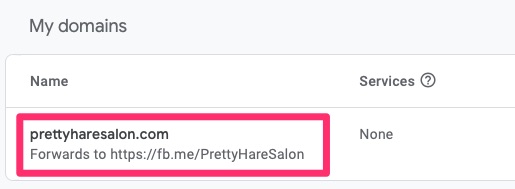
An example I will provide is setting up my wife’s business Pretty Hare Salon. She had a need for online presence, email and online booking for appointments.
Registrar and DNS Hosting
Once she filed her proper paperwork to register her business we were off to searching for a domain name and settled on prettyharesalon.com. Registering with Google Registrar services was easy and it was a mere $12/year for this domain including DNS services.
Some people get confused by the difference between the two. Registrar Services involves reserving the name and pointing to the DNS Hosting provider which in this case is also Google.
Forwarding
A neat feature of Google DNS is that you can do HTTP(S) forwarding. For her business she does not need a published web site as social media suffices for this for the time being. We opted to use HTTPS forwarding for www.prettyharesalon.com and redirect it to her Facebook page. This is a free service Google provides and quite helpful.
Domain forwarding to Facebook
Email
For email, we opted for a personal gmail account to save cost. Google Domains also allows forwarding email from her prettyharesalon.com to her personal account. We have a few addresses that we forward for. Her clients aren’t concerned that the correspondence comes from @prettyharesalon.com as they all know her. With that said, publishing the @prettyharesalon.com email addresses on social media helps greatly to those just finding her business.
If the email forwarding doesn’t work for your business, G Suite (Google’s Platform) offers flexible email hosting starting at roughly $6/month/account. I use that here at Woohoo Services for mine.
Web Site Hosting
If you do need to host a web site, Google Cloud does have hosting offerings including WordPress and a few others. See my article on how I set this up for this blog if you’re interested. I highly recommend putting CloudFlare or something similar in front of it though. Web sites get scanned and attacked on a daily basis, unbeknownst to the owner. This can damage your reputation.
Wix is another popular web hosting platform that is fairly easy to use.
Online Platform
Square is a great platform for startups that need to accept credit cards but cannot commit to monthly fees. It offers a fairly flat percentage structure on card swipes/dips that are predictable. It also offers free add-ons like the appointment module for businesses that require/prefer appointments and have a set list of services to offer.
Social Media
It goes without saying that social media is a most. It can be a free source of marketing and a great way to keep in touch with your clients. Do not limit yourself to just one though. Get on as many as you believe are relevant to your business. If you have a brick and mortar store, register that business with the major search engines, add your business hours to it, etc. You’d be surprised at how many people exclusively use Yelp or Google. Different people use different social media and its best to try to capture it all.
In my attempt to stand up this blog, I have gone through the Search Engine Optimization (SEO) process. This is the first time I have had to do this in roughly a decade or two. Quite a bit has changed but some things are still the same.
Patience
I started out expecting it to be fairly instant. Refreshing the screens every hour and then daily. The crawling and indexing seemed to run on its own terms.
One of the most important things to have is patience. It takes time for your site to get crawled, even after submitting site maps to various search engines. In today’s world of instant gratification, if it is a new site, it can take days or weeks for your site to get indexed.
Analytics
Analytics are the second most important part of this. You need to be able to measure traffic to your site. Google Analytics is a great thing to inject into your site. It is not the only source of analytics though.
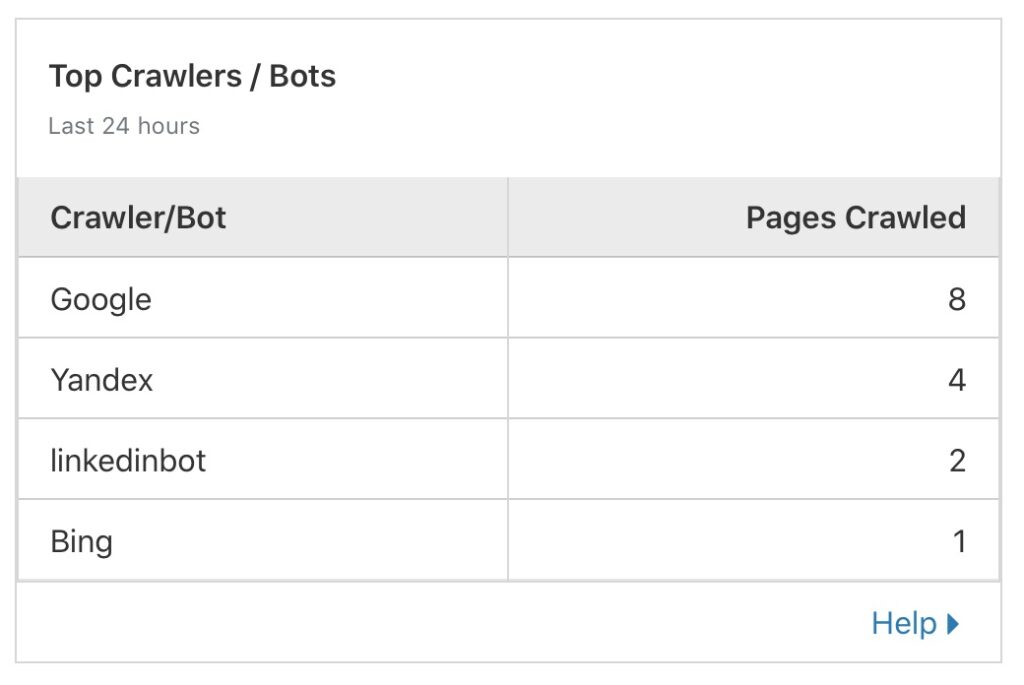
I currently use Cloudflare for this site. CloudFlare is great at providing some analytics as well. I particularly like the ability to see which “crawlers” are going through my site.
Cloudflare “crawlers”
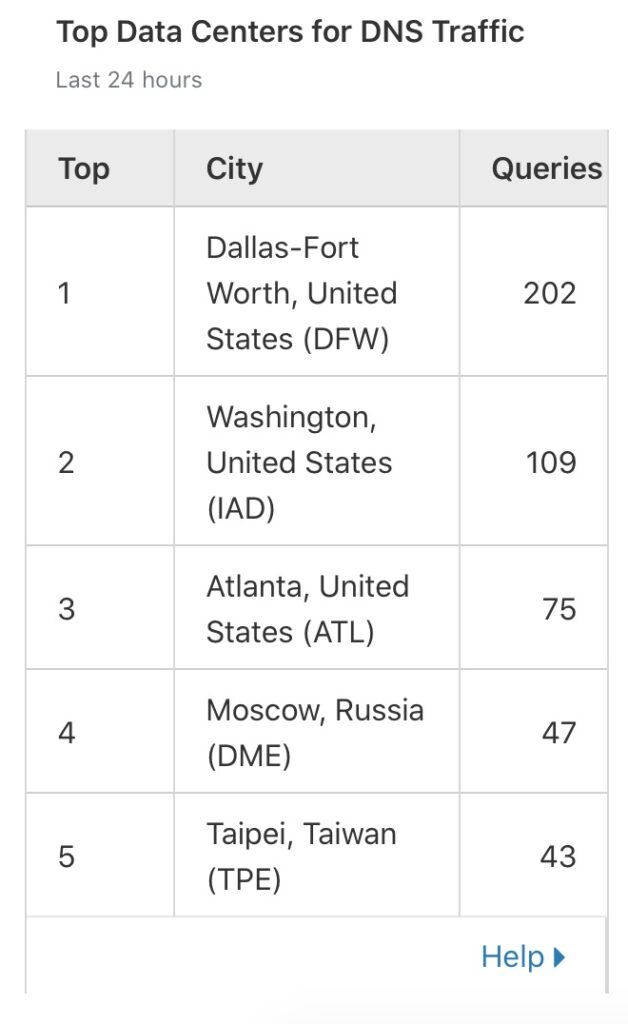
Not that it is terribly useful but since my DNS is hosted with Cloudflare, I get some metrics from that. It is neat to see where the queries are coming from.
Top DNS Queries
Analytics can help you determine the format of your information or time of day to release new content. Google Analytics is also great about telling you how you obtained the audience. Do most people see it through your Facebook feed, search or organic directly from your site?
Registering With Search Engines
Search engines need to know about you and your site. One quick way is to submit your site to the major ones. Google (Search Console), Bing (Webmaster) and Yandex (Webmaster) are a great start.
If your pages are not heavily linked to each other, a great idea is to upload a sitemap. This blog has that issue. If you are using a tool like WordPress, Yoast is a great tool to generate these. Yoast dynamically generates the site map.
Validating Site Content
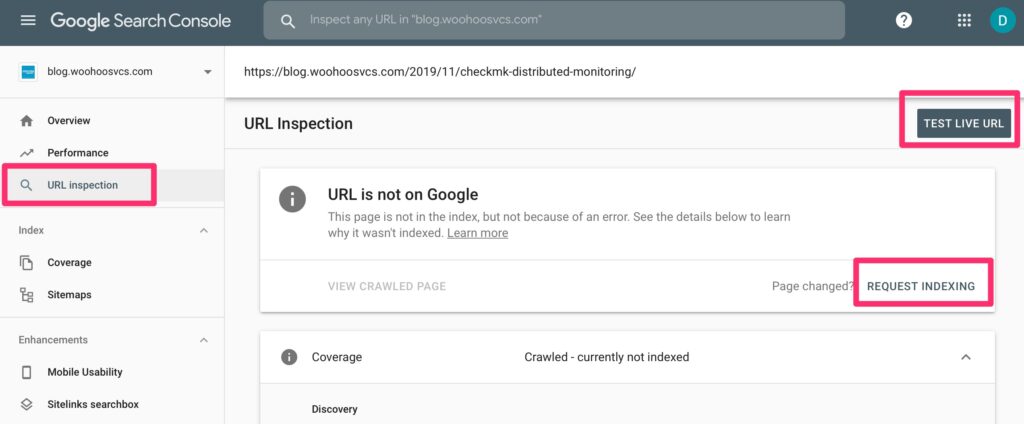
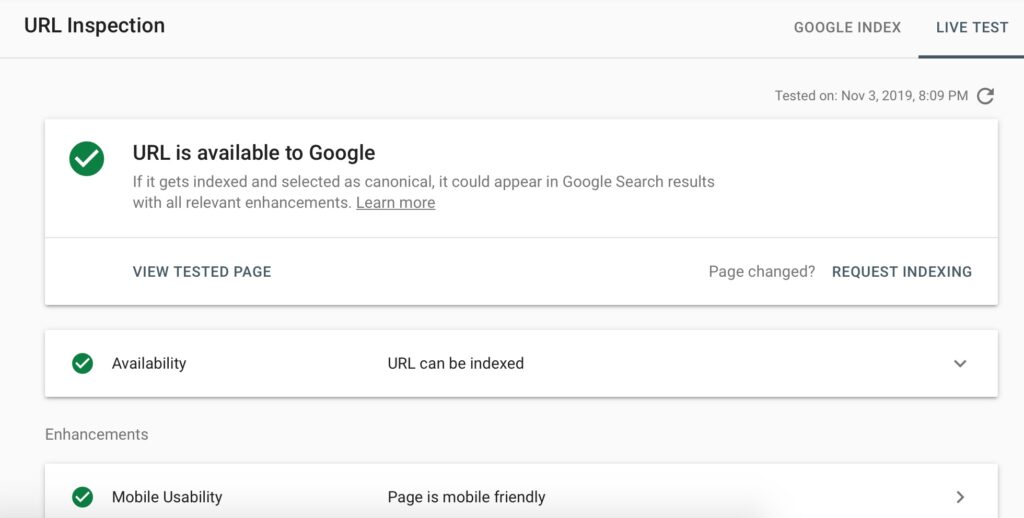
Google Search Console allows you to inspect the URL for issues which can help you pre-empt issues before they get into the index. Here you can see it has actually already crawled the site but not indexed it yet. Still worth a test!
URL Inspection in Google Search ConsoleURL Inspection in Google Search Console – Live Test – All “green”
Bing and Yandex have similar tools.
Addressing Issues
Try to resolve any issues the various tools detect fairly quickly. Excessive redirects, bad robots, 4XX or 5XX can cause some “crawl” pains. With limited resources, search engines have to optimize their crawl and allocate a “budget” to each site. Up and coming sites without a reputation have a minimal budget so you do not want issues getting in the way of that.
Focus on Quality Content
Whether your site is fairly static or you are pumping out content, ensure the quality remains. Google and other search engines prioritize original quality content. They also rate on readability and mobile friendliness.
Final Words
Hopefully this has helped you as a very introductory article on SEO. There are plenty of guides that go into much more depth into the various aspects of SEO.
The purpose of this guide is to show the strength and flexibility of CheckMK’s distributed monitoring. As you add hosts and services, the requirements can grow. It can be easy to get in the rut of adding more CPU and RAM until you have a monstrosity of a server that you cannot expand anymore.
Centrally monitoring all sites may not even work. The central CheckMK server may not have access to all of the remote devices.
Pre-requisites and Installation
To start off, we will need another CheckMK instance. If you do not already have one, check out the Introduction to CheckMK guide. Once you have CheckMK installed and a new unique site setup, the rest is trivial
Distributed monitoring also involves the slave listening on TCP/6557 so we need to open that up
[root@chckmk2 ~]# firewall-cmd --zone=public --add-port=6557/tcp --permanent
[root@chckmk2 ~]# firewall-cmd --reload

[root@chckmk2 ~]# su - second

OMD[second]:~$ omd config
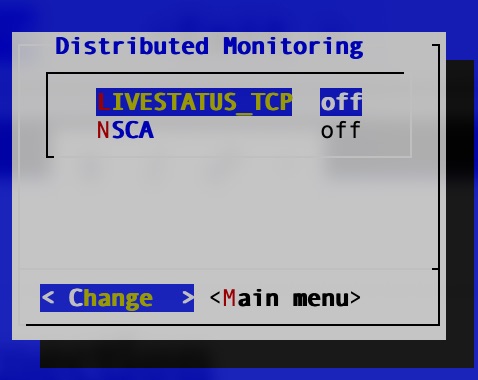
We then enable distributed monitoring and enable livestatus
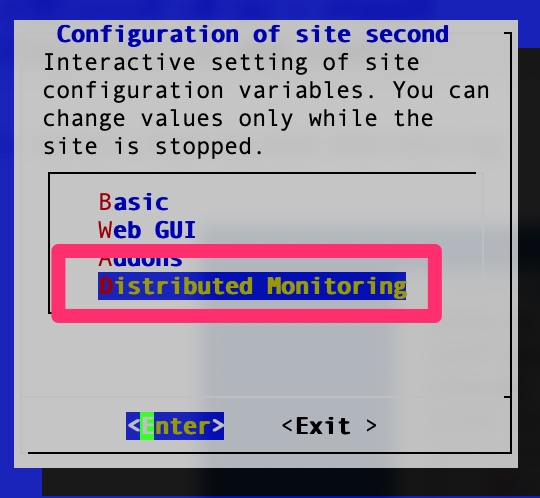
Select “Distributed Monitoring”omd livestatus
Enable livestatus which will listen on port 6557
Configure Connection
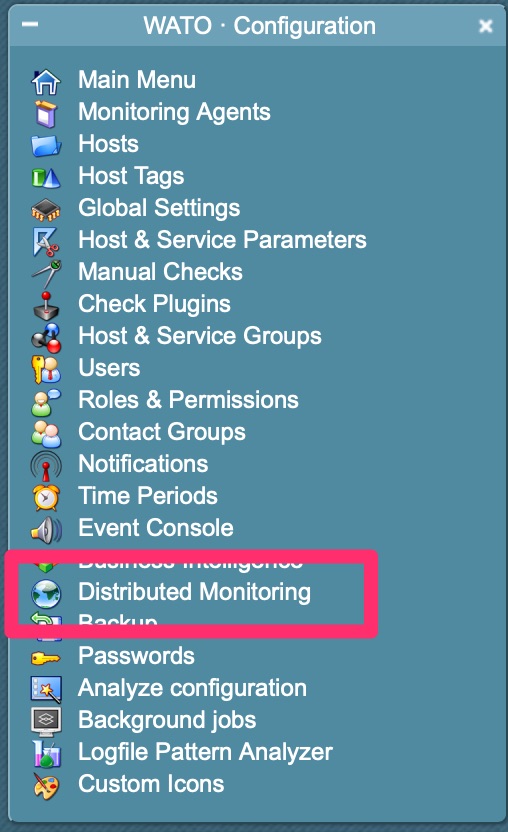
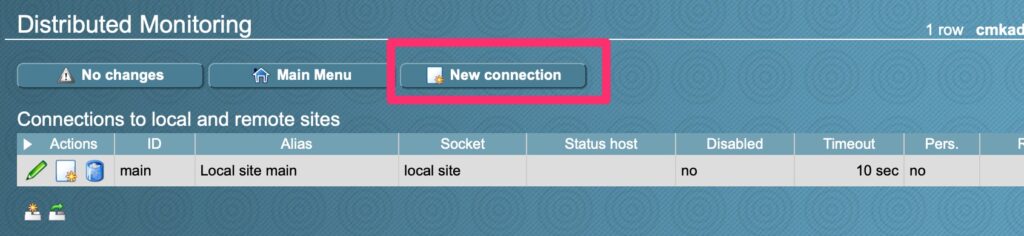
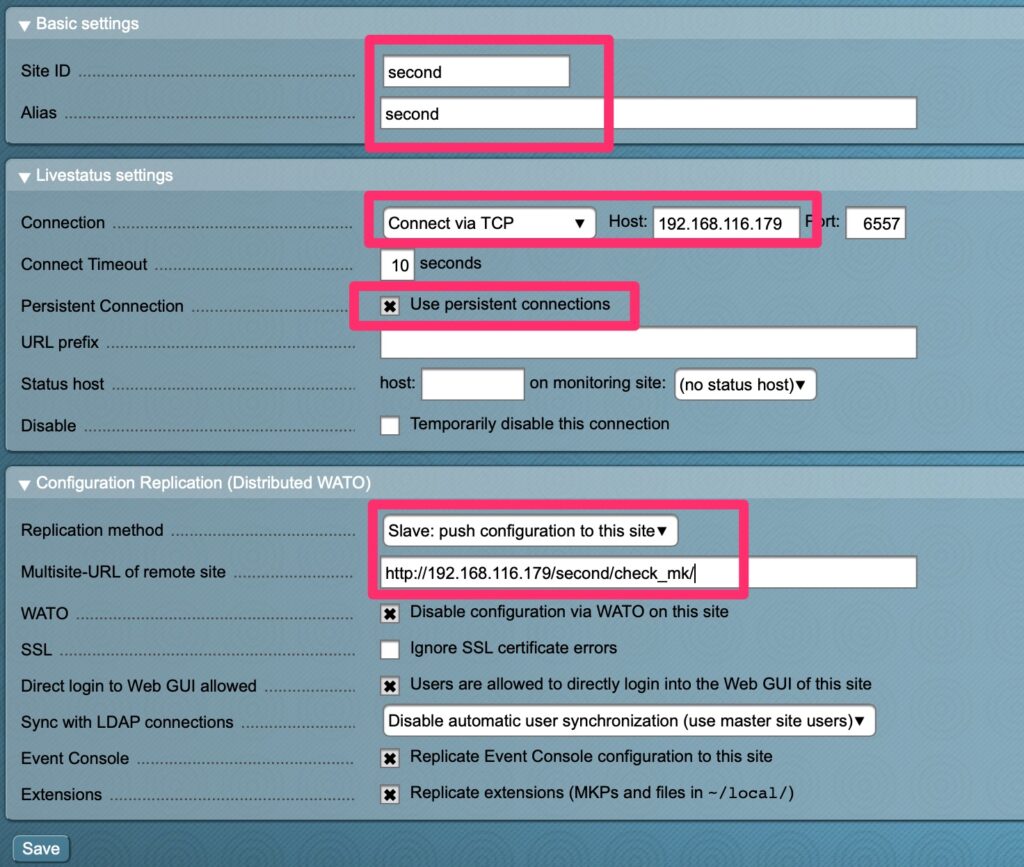
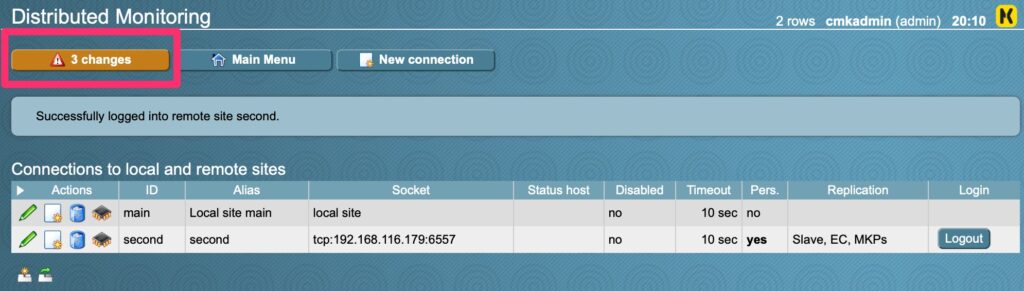
From the main site, in our series http://chckmk1.woohoosvcs.com/main navigate to Distributed Monitoring
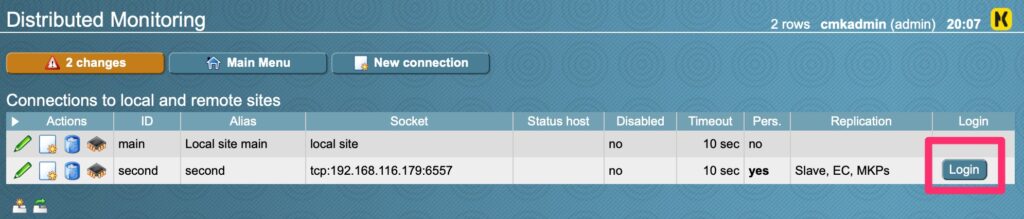
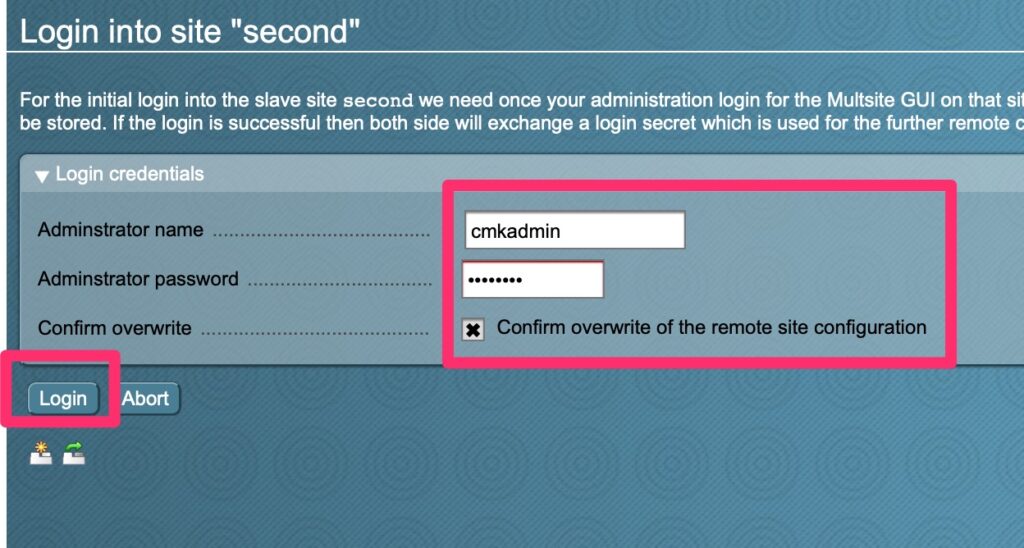
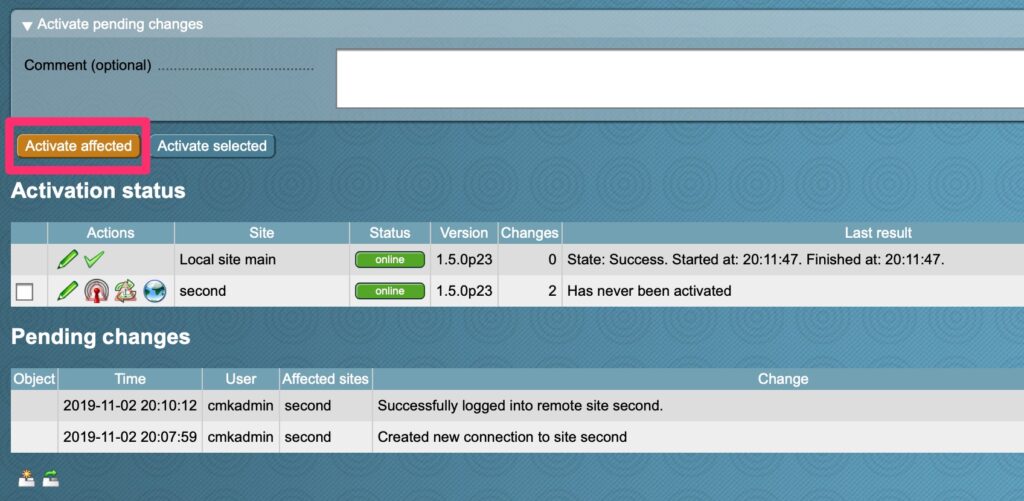
Distributed MonitoringNew ConnectionFill out the appropriate options. Select the credentials that have access to login to the second site.Login again!Save changesActivate!
Use Connection
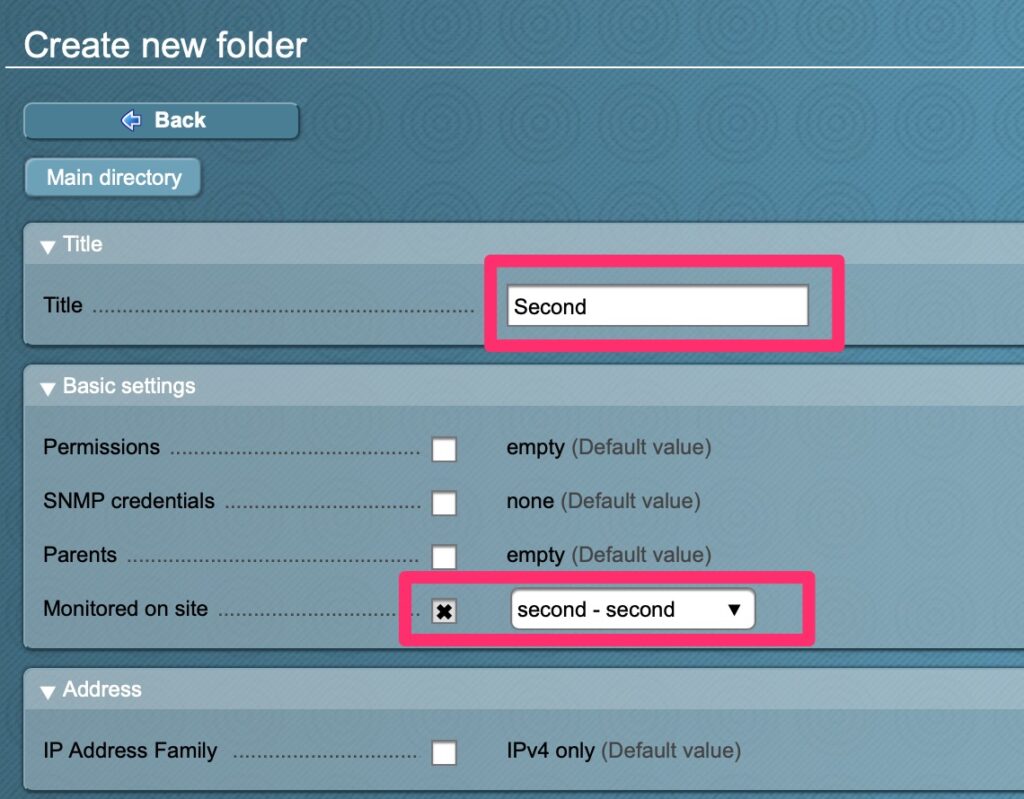
Now that we have the connection, how do we actually use it? One of the easiest and likely ways is to have a folder configured just with that monitoring site
Create a folder with a monitored site
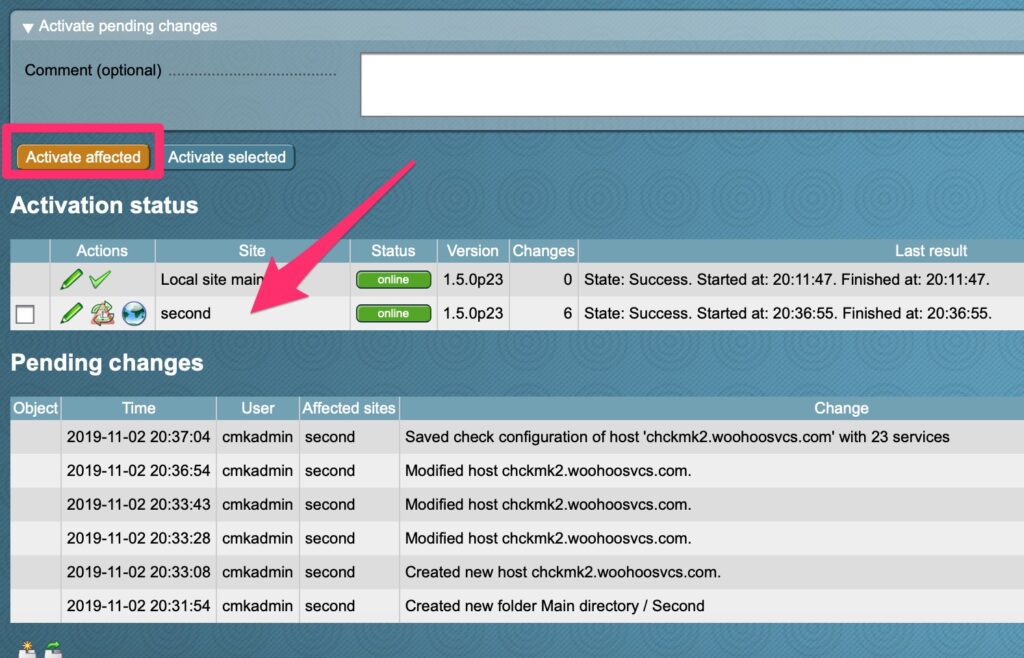
Next I added a host and put it in this new folder. Here you can see CheckMK is smart enough to know only the “second” site needs to be reloaded due to the changes that only affect it.
Activate second site changes
Final Words
This article was mostly pictures but hopefully the point comes across. That point is how flexible and easy it is to setup distributed monitoring via CheckMK.