In this article we will discuss the upgrade process using OMD. We will also go over the “werks” or changes and incompatibilities in the versions after upgrading.
If you have a fully functional environment such as one installed per Introduction to CheckMK – this should be fairly straight forward.
Prerequisites
CheckMK 1.5 RPM – We downloaded this in the previous article
Wait, what just happened? Was that it? Did it just get upgraded? Yes and no. CheckMK 1.5 was installed but our instance is not upgraded to it.
[root@chckmk1 ~]# omd sites
SITE             VERSION          COMMENTS
main             1.4.0p38.cre

[root@chckmk1 ~]# omd versions
1.4.0p38.cre
1.5.0p23.cre (default)
Each omd instance runs as the user so we will su to main to run commands for that instance
[root@chckmk1 ~]# su - main
OMD[main]:~$ omd update
Please completely stop 'main' before updating it.

# Yes that's a great idea!
OMD[main]:~$ omd stop
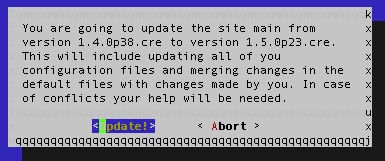
OMD[main]:~$ omd update
“omd update”
OMD[main]:~$ omd version
OMD - Open Monitoring Distribution Version 1.5.0p23.cre
OMD[main]:~$ omd start
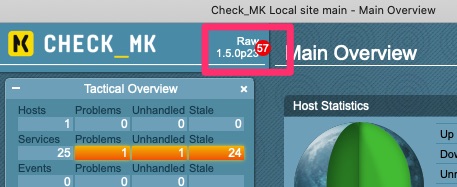
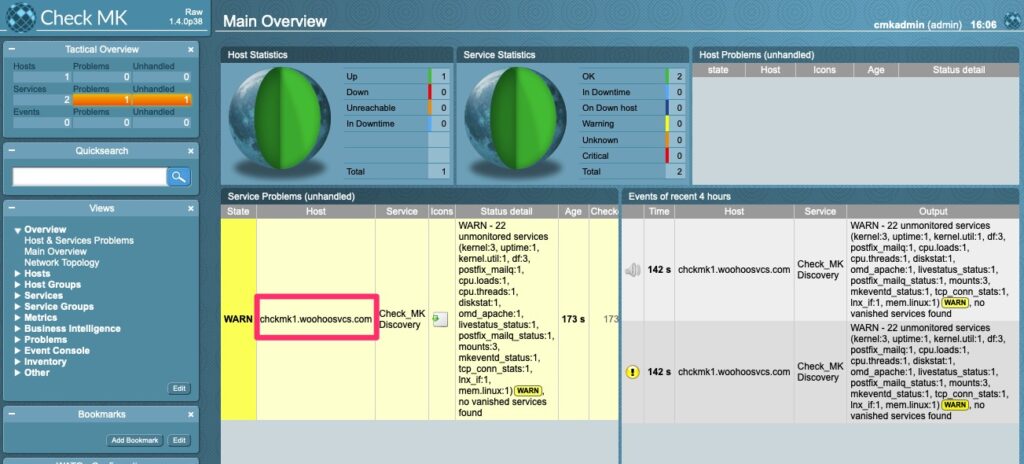
Version 1.5.0p23 with “57”
Are we there yet?
We most definitely are. We are on 1.5.0p23 and that went fairly well. But what is the “57”.
We can click on the 57 and there are 57 incompatible “werks” that we should be aware of. Many times these are non issues. Other times it is certain metrics that have gone away or configurations that have changed.
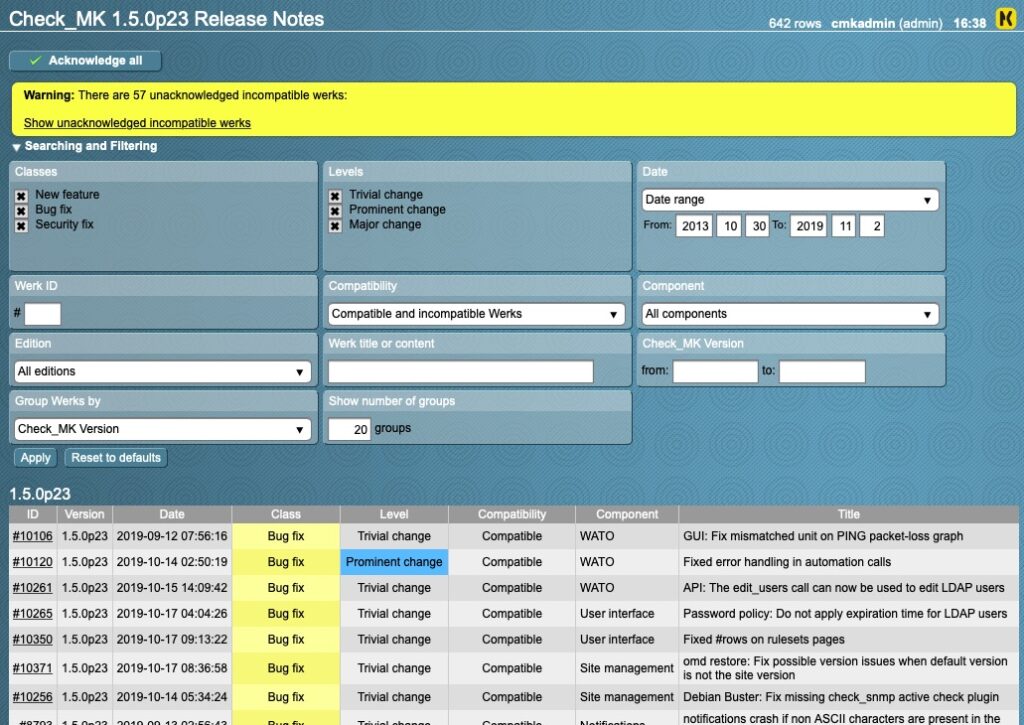
“Werks” AKA Release Notes
This is a huge help when upgrading. Instead of having to dig through text file release notes to see what major changes happened, we have werks! You can see any incompatible changes here and drilling into them will give you details on what to do. Once you have addressed it, you can acknowledge the werk.
Click on the “Show unacknowledged incompatible werks”
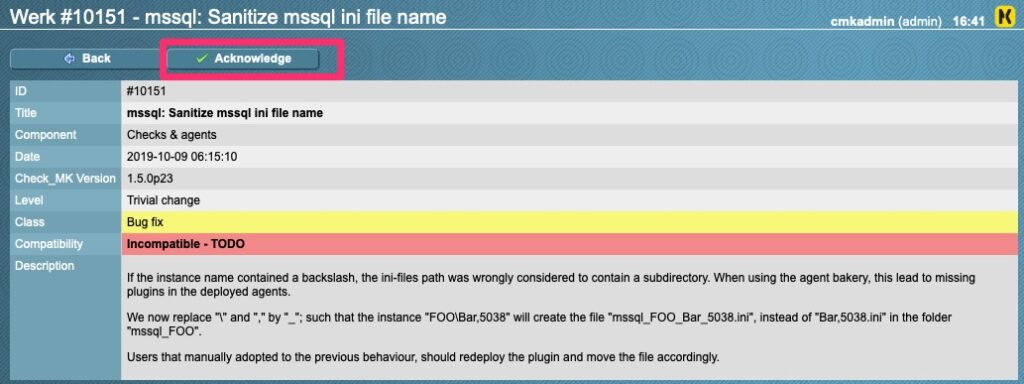
Incompatible werk. Address and acknowledge
As we can see here, there is a clear description of what changed. Once we have addressed, you can acknowledge and the 57 will decrement to 56.
You also have the option on the release notes page to “acknowledge all” if you really do not care to work through the werks. for this lab I have gone through this before and I will just acknowledge all.
If you have a large deployment, most of your time will be spent going through the werks and addressing. With that said, going from 1.4 to 1.5 has been a breeze. 1.2.8 to 1.4 was a bit rougher with more incompatible werks that caused issues.
Rollback
The power of OMD lets rollbacks come fairly easy. OMD does not care if an “upgrade” is going forward or backwards. The only issues you may have is if you made a config change only compatible or implemented in 1.5. In that case, 1.4 may have issues with it. Otherwise the rollback is the same as the upgrade. 1) stop the site 2) omd update
Final Words
Now we have a fairly up to date CheckMK. Try doing the same to 1.6.0? For my production deploys I usually wait for a few revisions and 1.6.0 is still very early for my tastes.
The purpose of this guide is to provide a high level overview of CheckMK. CheckMK is a great monitoring tool that has progressed greatly over the years. I have heavily depended on it for at least 3 years now.
Background
I came across CheckMK on a project that required a shot gun replacement of the current monitoring solution. A few solutions were vetted and Nagios was attempted. Unfortunately, the time to tweak and tune it was not compatible with the project timelines.
About CheckMK
CheckMK is an ecosystem that original was built around nagios. Many of the components of Nagios exist. Mathias Kettner is the founder of CheckMK.
There are quite a few editions but the scope of this is for the “Raw” edition. This is essentially the free unlimited tier.
Installation
Enough of the background, let’s get down to the technical installation
Requirements
For the purposes of this installation, we will be using a vanilla “minimal” install of CentOS 7.0. CentOS 7 is the latest supported version CheckMK supports. The VM will have 1 core, 1GB RAM and 8GB HDD. We will first be installing 1.4.0 so that the upgrade process can be shown.
curl -O https://checkmk.com/support/1.4.0p38/check-mk-raw-1.4.0p38-el7-85.x86_64.rpm

curl -O https://checkmk.com/support/1.5.0p23/check-mk-raw-1.5.0p23-el7-38.x86_64.rpm

# Always good to update first!
yum update

# Enable EPEL package repo
yum install https://dl.fedoraproject.org/pub/epel/epel-release-latest-7.noarch.rpm

# Then attempt to install
yum install check-mk-raw-1.4.0p38-el7-85.x86_64.rpm
Ok, great, ran through all of that. What’s next?
Configuration
Open Monitoring Distribution
CheckMK builds upon a framework called Open Monitoring Distribution (OMD). You may be asking, why the complexity? OMD makes upgrades quite useful and can allow you to run multiple versions of CheckMK on the same machine as OMD also allows multiple instances. The CheckMK rpms install this.
The first step after installing CheckMK will be to create an OMD site
# Here you can see there are no sites
[root@chckmk1 ~]# omd sites
SITE             VERSION          COMMENTS

# We then create a site
[root@chckmk1 ~]# omd create main
Adding /opt/omd/sites/main/tmp to /etc/fstab.
Creating temporary filesystem /omd/sites/main/tmp...OK
Restarting Apache...OK
Created new site main with version 1.4.0p38.cre.

  The site can be started with omd start main.
  The default web UI is available at http://chckmk1.woohoosvcs.com/main/

  The admin user for the web applications is cmkadmin with password: OkWZHNQr
  (It can be changed with 'htpasswd -m ~/etc/htpasswd cmkadmin' as site user.
)
  Please do a su - main for administration of this site.


[root@chckmk1 ~]# omd sites
SITE             VERSION          COMMENTS
main             1.4.0p38.cre     default version

[root@chckmk1 ~]# omd start main
Starting mkeventd...OK
Starting rrdcached...OK
Starting npcd...OK
Starting nagios...2019-11-02 15:43:45 [6] updating log file index
2019-11-02 15:43:45 [6] updating log file index
OK
Starting dedicated Apache for site main...OK
Initializing Crontab...OK

# Open port 80 with firewalld
[root@chckmk1 ~]# firewall-cmd --zone=public --add-service=http --permanent
success
[root@chckmk1 ~]# firewall-cmd --reload

# Set SELINUX

setsebool -P httpd_can_network_connect 1
If everything went well, you should be able to browse to the IP or URL and get a login page.
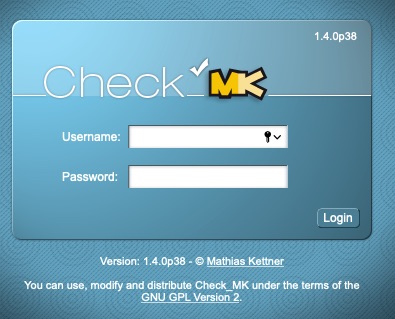
CheckMK 1.4.0 Login Page
It is really that simple. You now have a working CheckMK instance ready to be configured.
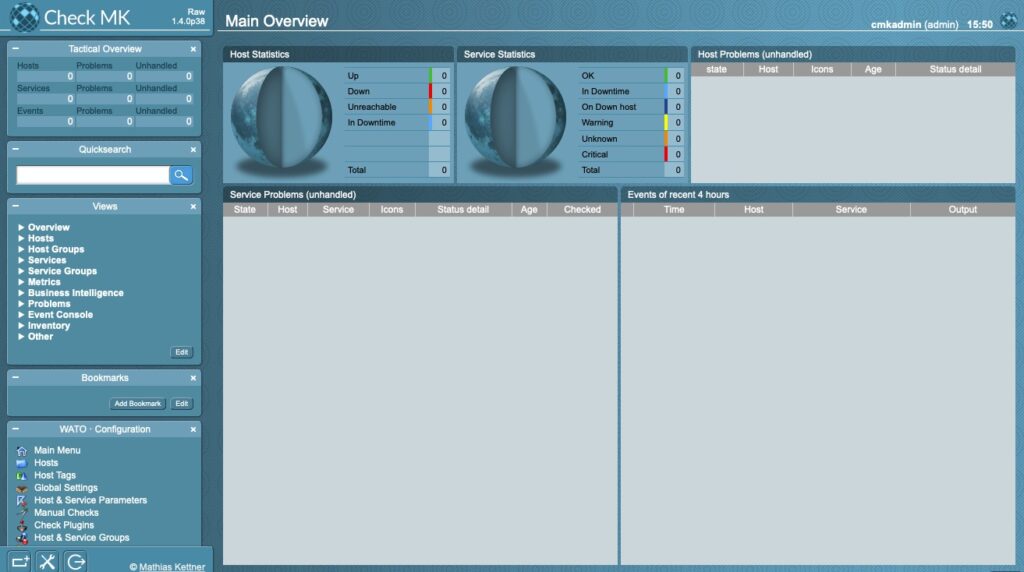
CheckMK Main Page
Configuring CheckMK Application
Now that we have a working instance and want to actually monitor something, why not the CheckMK server itself? There are a few options for this. You can use SNMP, CheckMK Agent or both. We will go over installing and configuring the agent.
Installing the CheckMK Agent
The agent requires xinetd as it essentially ties a script (the agent) to a socket/tcp port (6556). We will put the agent directly on the checkmk server.
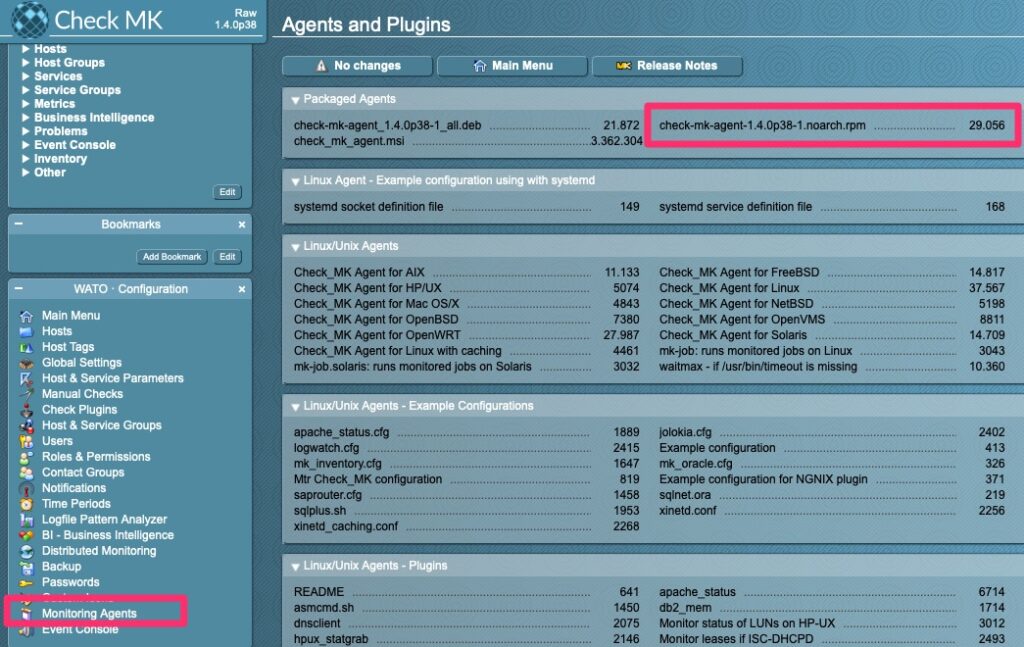
The agents can be found in the “Monitoring Agents” section. For RPM based distributions it is easy to just install the RPM.
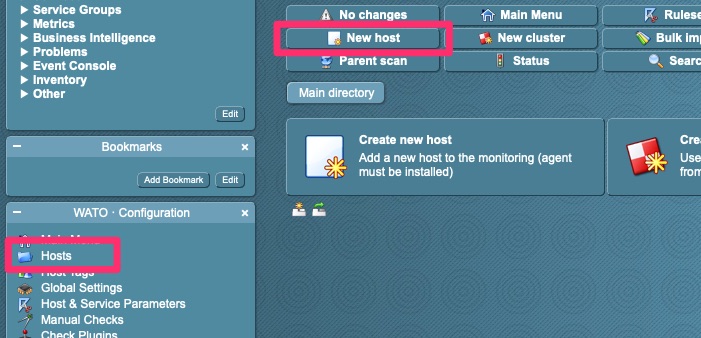
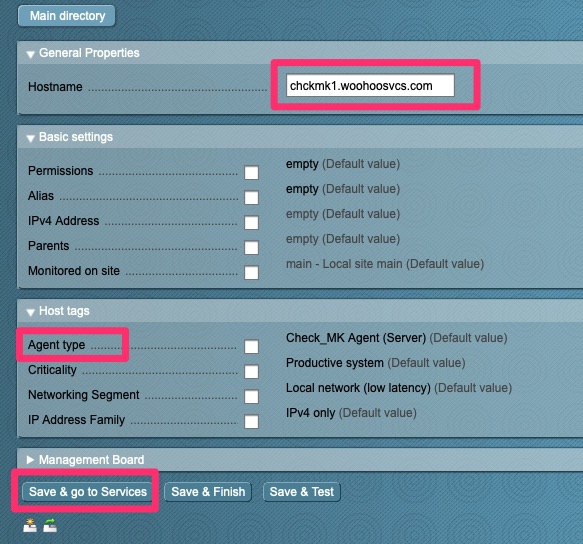
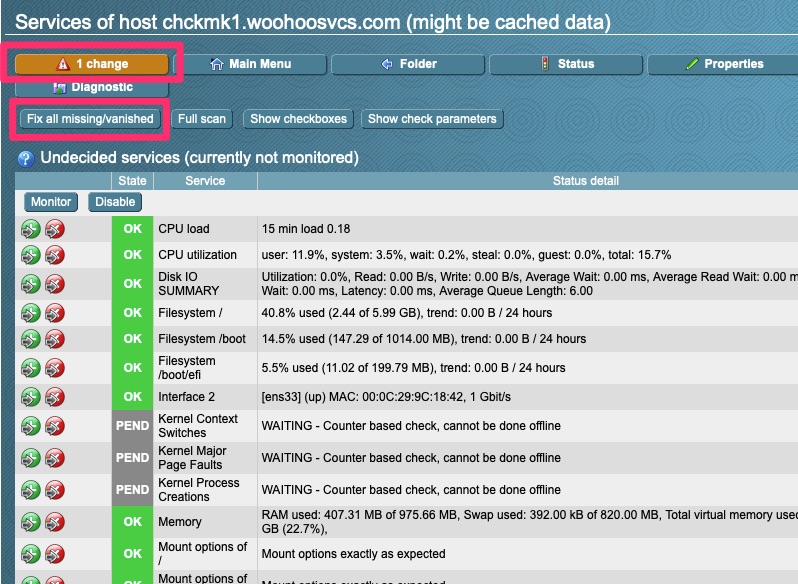
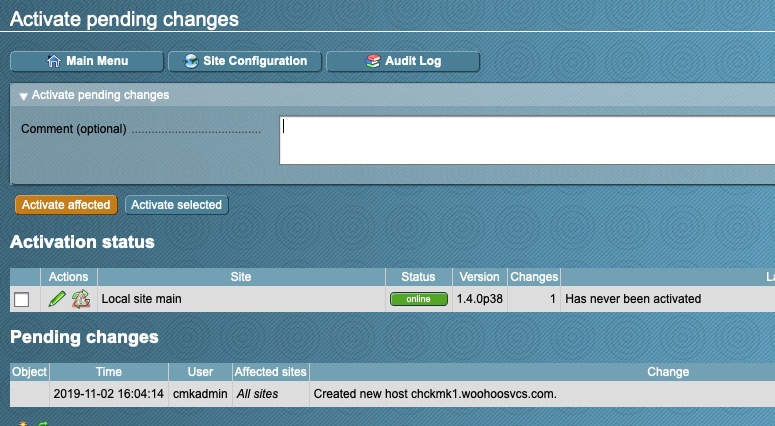
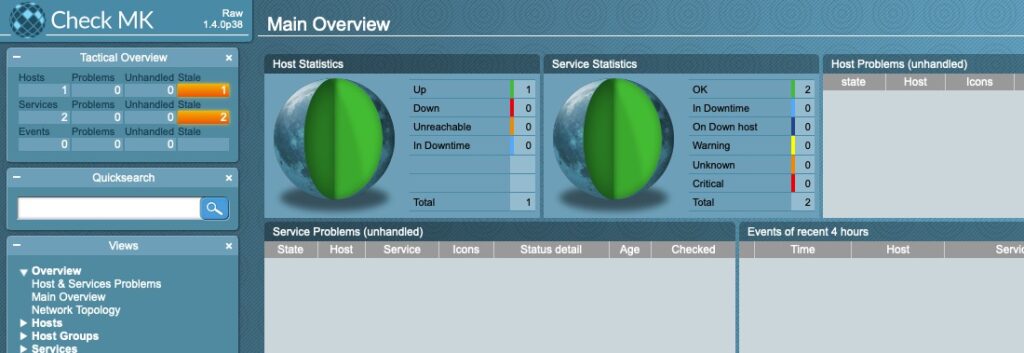
Go to “Hosts” and then “New host”Enter the Hostname or IP. The agent type defaults to Check_MK Agent but I wanted to point it out. You then want to “Save & go to Services”.This screen shows all of the services it can monitor. We want to “Fix all missing/vanished” and then save “1 change” which should after this actually change to save “2 changes”.At this point we need to activate those changes. This typically requires a reload of Nagios which the activation does.But wait, what am I seeing now and why are those hosts stale?Here we go, some activity!
At this point, we added a host and added some metrics to it. It ran through a discovery and found some more. Many times this happens. This is because some checks run asynchronously in the background. The first time you check a host, it does not return all of the services. On the second run they show up. From here you can go through similar steps to click on the host and acknowledge the new services.
In this case I simply forgot to follow my own instructions and click the “fix button”. Likely more services would have shown up later but not as many in the screenshot.
Other Configurations
Just because we have a monitoring system in place does not mean it is fully configured. We still have notifications, alert levels and many other tuning. Those are out of scope of this document but I will likely generate them going forward.
Final Words
We stood up a Check_MK server from scratch and are monitoring one host. At the beginning of the article I discussed upgrading. I will follow up with another article on upgrading. The process is fairly simple but there
Now that we’ve stood up a majority of the framework we can get to some of the fun stuff. Namely Kubernetes Dashboard. Due to compatibility reasons we will be using 2.0beta1. Newer 2.0 betas are not well tested and I ran into some issues with our 1.14 that Photon comes with.
Download and Install
This is short and sweet. As usual, I like to download and then install. I didn’t like the name of this file though so I renamed it.
curl -O https://raw.githubusercontent.com/kubernetes/dashboard/v2.0.0-beta1/aio/deploy/recommended.yaml

mv recommended.yaml dashboard-2b1.yaml

kubectl apply -f dashboard-2b1.yaml
namespace/kubernetes-dashboard created
serviceaccount/kubernetes-dashboard created
service/kubernetes-dashboard created
secret/kubernetes-dashboard-certs created
secret/kubernetes-dashboard-csrf created
secret/kubernetes-dashboard-key-holder created
configmap/kubernetes-dashboard-settings created
role.rbac.authorization.k8s.io/kubernetes-dashboard created
clusterrole.rbac.authorization.k8s.io/kubernetes-dashboard created
rolebinding.rbac.authorization.k8s.io/kubernetes-dashboard created
clusterrolebinding.rbac.authorization.k8s.io/kubernetes-dashboard created
deployment.apps/kubernetes-dashboard created
service/dashboard-metrics-scraper created
deployment.apps/kubernetes-metrics-scraper created
Health Check
The dashboard namespace is kubernetes-dashboard so we run the following.
root@kube-master [ ~/kube ]# kubectl get all --namespace=kubernetes-dashboard
NAME                                              READY   STATUS    RESTARTS   AGE
pod/kubernetes-dashboard-6f89577b77-pbngw         1/1     Running   0          27s
pod/kubernetes-metrics-scraper-79c9985bc6-kj6h5   1/1     Running   0          28s

NAME                                TYPE        CLUSTER-IP       EXTERNAL-IP   PORT(S)    AGE
service/dashboard-metrics-scraper   ClusterIP   10.254.189.11    <none>        8000/TCP   57s
service/kubernetes-dashboard        ClusterIP   10.254.127.216   <none>        443/TCP    61s

NAME                                         READY   UP-TO-DATE   AVAILABLE   AGE
deployment.apps/kubernetes-dashboard         1/1     1            1           57s
deployment.apps/kubernetes-metrics-scraper   1/1     1            1           57s

NAME                                                    DESIRED   CURRENT   READY   AGE
replicaset.apps/kubernetes-dashboard-6f89577b77         1         1         1       29s
replicaset.apps/kubernetes-metrics-scraper-79c9985bc6   1         1         1       29s
Connecting
On the main Dashboard page it indicates you can access via running “kubectl proxy” and access the URL. This is where it gets a little tricky. Not for us since we have flannel working, even on the master. Simply download the Kubernetes kubectl client for your OS and run it locally.
dwcjr@Davids-MacBook-Pro ~ % kubectl proxy
Starting to serve on 127.0.0.1:8001
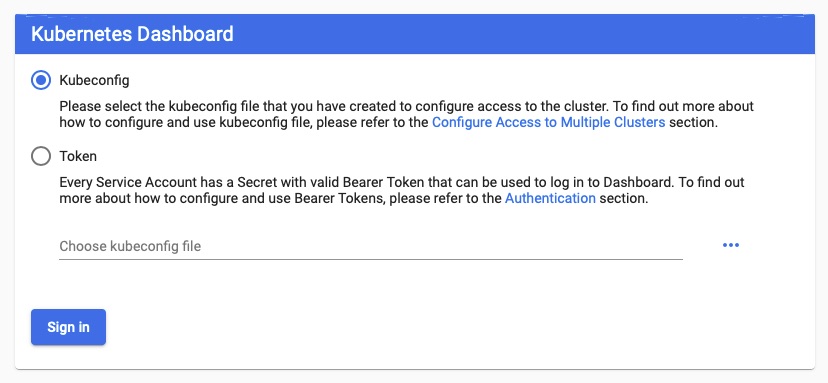
At the bottom of the output should be a token section that you can plug into the token request.
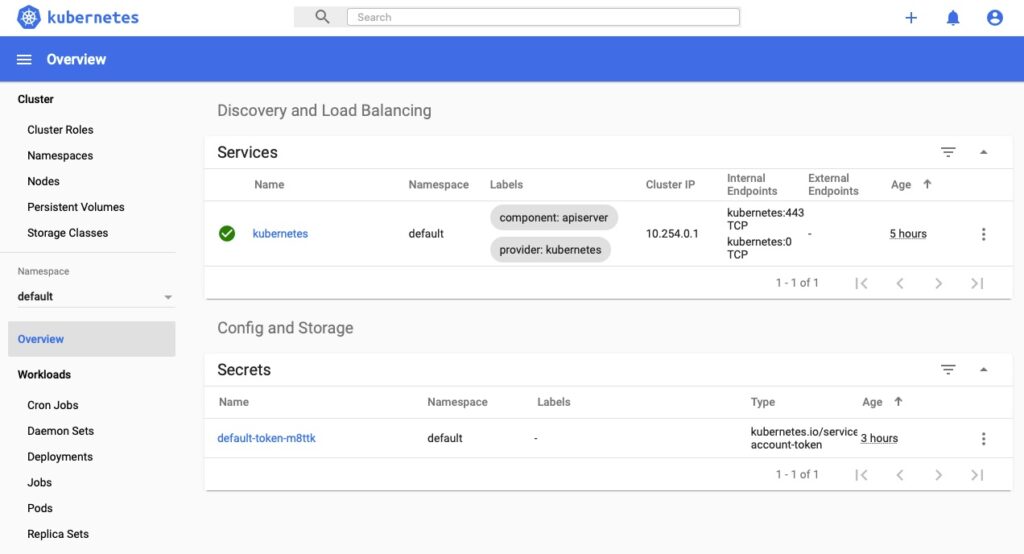
From here you’ve made it. Things just got a whole lot easier if you’re a visual learner!
Final Words
I may write a few more articles on this but that this point we have a very functional Kubernetes Cluster that can deploy apps given we throw enough resources at the VMs. Other topics that need to be covered are networking and the actual topology. I feel that one of the best ways to learn a platform or technology is to push through a guided install and then understand what the components are. This works for me but not everyone.
With all the pre-requisites met, including SSL, flannel is fairly simple to install and configure. Where it goes wrong is if some of those pre-requisites have not been met or are misconfigured. You will star to find that out in this step.
We will be running flannel in a docker image, even on the master versus a standalone which is much easier to manage.
Why Do We Need Flannel Or An Overlay?
Without flannel, each node has the same IP range associated with docker. We could change this and manage it ourselves. We would then need to setup firewall rules and routing table entries to handle this. Then we also need to keep up with ip allocations.
Flannel does all of this for us. It does so with a minimal amount of effort.
Staging for Flannel
Config
We need to update /etc/kubernetes/controller-manager again and add
I always prefer to download my yaml files so I can review and replay as necessary. Per their documentation I am just going to curl the URL and then apply it
On each node we need to add the following the the /etc/kubernetes/kubelet config and then restart kubelet
KUBELET_ARGS="--network-plugin=cni"
Firewall
Since flannel is an overlay, it overlays over the existing network and we need to open UDP/8285 per their doc. Therefore we need to put this in iptables on each host
# This line for VXLAN
-A INPUT -p udp -m udp --dport 8472 -j ACCEPT

# This line for UDP
-A INPUT -p udp -m udp --dport 8285 -j ACCEPT
Fire it up!
Now we are ready to apply and let it all spin up!
root@kube-master [ ~/kube ]# curl -O https://raw.githubusercontent.com/coreos/flannel/master/Documentation/kube-flannel.yml

root@kube-master [ ~/kube ]# kubectl apply -f kube-flannel.yml
podsecuritypolicy.policy/psp.flannel.unprivileged created
clusterrole.rbac.authorization.k8s.io/flannel created
clusterrolebinding.rbac.authorization.k8s.io/flannel created
serviceaccount/flannel created
configmap/kube-flannel-cfg created
daemonset.apps/kube-flannel-ds-amd64 created
daemonset.apps/kube-flannel-ds-arm64 created
daemonset.apps/kube-flannel-ds-arm created
daemonset.apps/kube-flannel-ds-ppc64le created
daemonset.apps/kube-flannel-ds-s390x created
If all is well at this point, it should be chewing through CPU and disk and in a minute or two the pods are deployed!
root@kube-master [ ~/kube ]# kubectl get pods --namespace=kube-system
NAME                          READY   STATUS    RESTARTS   AGE
kube-flannel-ds-amd64-7dqd4   1/1     Running   17         138m
kube-flannel-ds-amd64-hs6c7   1/1     Running   1          138m
kube-flannel-ds-amd64-txz9g   1/1     Running   18         139m
On each node you should see a “flannel” interface now too.
root@kube-master [ ~/kube ]# ifconfig -a | grep flannel
flannel.1 Link encap:Ethernet  HWaddr 1a:f8:1a:65:2f:75
Troubleshooting Flannel
From the “RESTARTS” section you can see some of them had some issues. What kind of blog would this be if I didn’t walk you through some troubleshooting steps?
I knew that the successful one was the master so it was likely a connectivity issue. Testing “curl -v https://10.254.0.1” passed on the master but failed on the nodes. By pass, I mean it made a connection but complained about the TLS certificate (which is fine). The nodes, however, indicated some sort of connectivity issue or firewall issue. So I tried the back end service member https://192.168.116.174:6443 and same symptoms. I would have expected Kubernetes to open up this port but it didn’t so I added it to iptables and updated my own documentation.
Some other good commands are “kubectl logs <resource>” such as
root@kube-master [ ~/kube ]# kubectl logs pod/kube-flannel-ds-amd64-txz9g --namespace=kube-system
I1031 18:47:14.419895       1 main.go:514] Determining IP address of default interface
I1031 18:47:14.420829       1 main.go:527] Using interface with name eth0 and address 192.168.116.175
I1031 18:47:14.421008       1 main.go:544] Defaulting external address to interface address (192.168.116.175)
I1031 18:47:14.612398       1 kube.go:126] Waiting 10m0s for node controller to sync
I1031 18:47:14.612648       1 kube.go:309] Starting kube subnet manager
....
You will notice the “namespace” flag. Kubernetes can segment resources into namespaces. If you’re unsure of which namespace something exists in, you can use “–all-namespaces”
Final Words
Now we have a robust network topology where pods can have unique IP ranges and communicate to pods on other nodes.
Next we will be talking about Kubernetes Dashboard and how to load it. The CLI is not for everyone and the dashboard helps put things into perspective.
Picking up where we left off in the Initializing Kubernetes article, we will now be setting up certificates! This will be closely following the Kubernetes “Certificates” article. Specifically using OpenSSL as easyrsa has some dependency issues with Photon.
OpenSSL
Generating Files
We’ll be running the following commands and I keep them in /root/kube/certs. They won’t remain there but its a good staging area that needs to be cleaned up or secured so we don’t have keys laying around.
In my environment the MASTER_IP is 192.168.116.174 and the cluster IP is usually a default but we can get it by running kubectl
root@kube-master [ ~/kube ]# kubectl get services kubernetes
NAME         TYPE        CLUSTER-IP   EXTERNAL-IP   PORT(S)   AGE
kubernetes   ClusterIP   10.254.0.1   <none>        443/TCP   60m
[ req ]
default_bits = 2048
prompt = no
default_md = sha256
req_extensions = req_ext
distinguished_name = dn

[ dn ]
C = US
ST = Texas
L = Katy
O = Woohoo Services
OU = IT
CN = 192.168.116.174

[ req_ext ]
subjectAltName = @alt_names

[ alt_names ]
DNS.1 = kubernetes
DNS.2 = kubernetes.default
DNS.3 = kubernetes.default.svc
DNS.4 = kubernetes.default.svc.cluster
DNS.5 = kubernetes.default.svc.cluster.local
IP.1 = 192.168.116.174
IP.2 = 10.254.0.1

[ v3_ext ]
authorityKeyIdentifier=keyid,issuer:always
basicConstraints=CA:FALSE
keyUsage=keyEncipherment,dataEncipherment
extendedKeyUsage=serverAuth,clientAuth
subjectAltName=@alt_names
We need to copy the ca.crt to /etc/ssl/certs/kube-ca.pem on each node and then install the package “openssl-c_rehash” as I found here. Photon is very minimalistic so you will find you keep having to add packages for things you take for granted.
tdnf install openssl-c_rehash

c_rehash
Doing //etc/ssl/certs
link 3513523f.pem => 3513523f.0
link 76faf6c0.pem => 76faf6c0.0
link 68dd7389.pem => 68dd7389.0
link e2799e36.pem => e2799e36.0
.....
link kube-ca.pem => 8e7edafa.0
Final Words
At this point, you have a Kubernetes cluster setup with some basic security. Not very exciting, at least in terms of seeing results but the next article should be meaningful to show how to setup flannel.
In my previous article Intro To Kubernetes, we walked through installing dependencies and setting the stage for initializing Kubernetes. At this point you should have a master and one or two nodes with the required software installed.
A Little More Configuration
Master Config Prep
We have just a little more configuration to do. On kube-master we need to change “/etc/kubenertes/apiserver” lines as follows. This allows other hosts to connect to it. If you don’t want to bind to 0.0.0.0 you could bind to the specific IP but would lose localhost binding.
# From this
KUBE_API_ADDRESS="--insecure-bind-address=127.0.0.1"

# To this
KUBE_API_ADDRESS="--address=0.0.0.0"
Create the Cluster Member Metadata
Save the following as a file, we’ll call it create_nodes.json. When standing up a cluster I like to start out with doing it on the master so I create a /root/kube and put my files in there for reference.
We can then run kubectl to create the nodes based on that json. Keep in mind this is just creating metadata
root@kube-master [ ~/kube ]# kubectl create -f /root/kube/create_nodes.json
node/kube-master created
node/kube-node1 created
node/kube-node2 created

# We also want to "taint" the master so no app workloads get scheduled.

kubectl taint nodes kube-master key=value:NoSchedule

root@kube-master [ ~/kube ]# kubectl get nodes
NAME          STATUS     ROLES    AGE   VERSION
kube-master   NotReady   <none>   88s
kube-node1    NotReady   <none>   88s
kube-node2    NotReady   <none>   88s
You can see they’re “NotReady” because the services have not been started. This is expected at this point.
All Machine Config Prep
This will be run on all machines, master and node. We need to edit “/etc/kubernetes/kubelet”
server: http://127.0.0.1:8080

# Should be

server: http://kube-master:8080
In /etc/kubernetes/config
KUBE_MASTER="--master=http://kube-master:8080"
Starting Services
Master
The VMware Photon Kubernetes guide we have been going by has the following snippit which I want to give credit to. Please run this on the master
for SERVICES in etcd kube-apiserver kube-controller-manager kube-scheduler kube-proxy kubelet docker; do
     systemctl restart $SERVICES
     systemctl enable $SERVICES
     systemctl status $SERVICES
 done
You can then run “netstat -an | grep 8080” to see it is listening. Particularly on 0.0.0.0 or the expected bind address.
Nodes
On the nodes we are only starting kube-proxy, kubelet and docker
for SERVICES in kube-proxy kubelet docker; do
     systemctl restart $SERVICES
     systemctl enable $SERVICES
     systemctl status $SERVICES
 done
Health Check
At this point we’ll run kubectl get nodes and see the status
root@kube-master [ ~/kube ]# kubectl get nodes
NAME          STATUS     ROLES    AGE     VERSION
127.0.0.1     Ready      <none>   23s     v1.14.6
kube-master   NotReady   <none>   3m13s
kube-node1    NotReady   <none>   3m13s
kube-node2    NotReady   <none>   3m13s
Oops, we didn’t add 127.0.0.1 – I forgot to clear the hostname override in /etc/kubernetes/kubelet. Fixed that, restarted kubelet and then “kubectl delete nodes 127.0.0.1”
It does take a while for these to start showing up. The provisioning and orchestration processes are not fast but you should slowly show the version show up and then the status to Ready and here we are.
root@kube-master [ ~/kube ]# kubectl get nodes
NAME          STATUS   ROLES    AGE     VERSION
kube-master   Ready    <none>   9m42s   v1.14.6
kube-node1    Ready    <none>   9m42s   v1.14.6
kube-node2    Ready    <none>   9m42s   v1.14.6
Final Words
At this point we could start some pods if we wanted but there are a few other things that should be configured for a proper bare metal(or virtual) install. Many pods are now depending on auto discovery which uses TLS. Service accounts also need and service accounts are using secrets.
For the networking we will go over flannel which will provide our networking overlay using VXLAN. This is needed so that pods running on each node have a unique and routable address space that each node can see. Right now each node has a docker interface with the same address and pods on different nodes cannot communicate with each other.
Flannel uses the TLS based auto discovery to the ClusterIP. Without hacking it too much it is just best to enable SSL/TLS Certificates and also a security best practice.
This will be part of a multi-part set of posts on Kubernetes. There are many other technical articles on this but I could not find one that got me end to end to my desired state with Kubernetes. These series of posts will help carry you through my journey at standing it up.
What This Is Not
Currently, this series is not a high level architecture overview. It does not go into detail of the various daemons and their function. I may create a separate article on this at a later date.
Why Kubenertes?
Kubernetes aka k8s, is great at provisioning resources and maintaining them for containerized workloads using Docker. Per the site’s tag line, “Production-Grade Container Orchestration”. It was developed in house by Google and shared with the public. Therefore Google Cloud’s Kubernetes offering is one of the better ones. Docker Swarm is Docker’s response to the need this fills.
Let’s Get Started!
For this series I will be using VMware Photon OS. You are more than welcome to use any distribution you wish although many of the commands may not be the same, particularly the package management commands to install software. I use VMware Fusion but any hypervisor or bare metal systems will suffice. We will be standing up 3 total nodes but you can do with 2 if resources are at a minimum.
We will also be following VMware’s Guide to installing Photon on Kubernetes with a minor tweak.
Installation
Install the OS
If you are looking to install something like Kubernetes it is assumed you are fairly familiar with installing an OS. For this we will need 3 instances of Photon. I am provisioning them with 4GB HDD, 1 core, 768 MB of RAM and removing any excess virtual hardware not needed since the machine I am running this on only has 8GB of RAM and dual core.
The machine names will be kube-master, kube-node1 and kube-node2
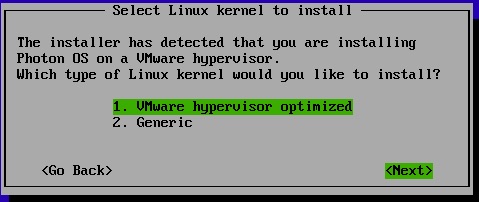
For Photon, you can pretty much accept the defaults with the kernel type being the only one you may need to think about. Photon can go on bare metal or even other hypervisors, but it does have a VMware optimized kernel with vm tools if you choose.
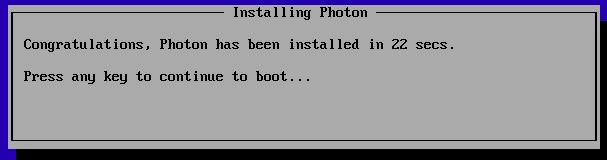
Photon is very proud of their install times, but it is nice not waiting 10-20 mins for an OS install
Login to the OS
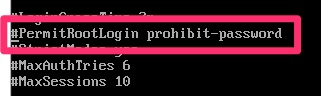
By default, most recent distributions of Linux, including Photon are locked down. You can login to root at the console but not remotely unless you use ssh keys authentication. For production workloads, I would highly recommend not using the root login and instead using another login and sudo but for the purpose of this lab we will just add my local key to root and be on our way.
I personally use ssh-copy-id which is a best practice
dwcjr@Davids-MacBook-Pro ~ % ssh-copy-id -i ~/.ssh/id_rsa.pub [email protected]
/usr/bin/ssh-copy-id: INFO: Source of key(s) to be installed: "/Users/dwcjr/.ssh/id_rsa.pub"
/usr/bin/ssh-copy-id: INFO: attempting to log in with the new key(s), to filter out any that are already installed
/usr/bin/ssh-copy-id: INFO: 1 key(s) remain to be installed -- if you are prompted now it is to install the new keys
Password:

Number of key(s) added:        1

Now try logging into the machine, with:   "ssh '[email protected]'"
and check to make sure that only the key(s) you wanted were added.
Installing Kubernetes on Master and Nodes
Photon uses tdfn so its quite simple. This is also where we deviate slightly from the instructions. We will be enabling all of the node services on the master so that it can run docker images. We do not want to run actual app images but there is a particular system image we will want to run that I will get into later
On Master and Nodes run the following
tdnf install kubernetes iptables docker

# Good idea to run through updates afterwards as well
tdnf update
Preparing Hosts
Next its a good idea to have a hosts file entry since we will not be using DNS for the scope of these tutorials. These are my IPs in this case.
We then need to set /etc/kubernetes/config on all hosts to specifically update
KUBE_MASTER="--master=http://kube-master:8080"
On the master, we need to edit “/etc/systemd/scripts/ip4save” to add the following lines
-A INPUT -p tcp -m tcp --dport 8080 -j ACCEPT
-A INPUT -p tcp -m tcp --dport 6443 -j ACCEPT
-A INPUT -p tcp -m tcp --dport 10250 -j ACCEPT

#Then restart iptables.  On photon it doesn't appear to save IP tables between reboots so this is how it persists.

systemctl restart iptables
On the nodes you will need to add a similar line and restart iptables but it will be
-A INPUT -p tcp -m tcp --dport 10250 -j ACCEPT
Ending Note
At this point you do not quite have anything near a functional Kubernetes cluster but this was the first part in a few. I decided to break this article at this point as some people may be able to easily get here without these instructions.
For those that made it here, my next article will link here for the initial Kubernetes Configuration
A few years ago Comodo CA was spun off from Comodo’s offering and rebranded as Sectigo. You can read more about it from the horse’s mouth here.
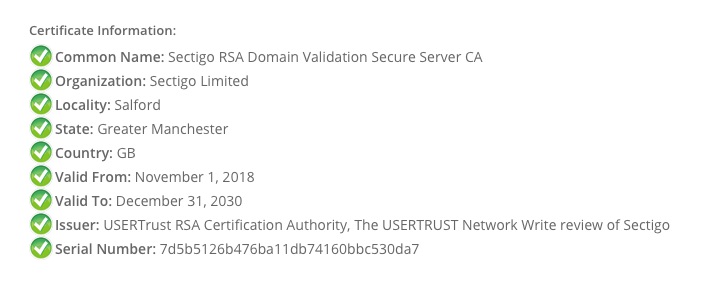
During this transition Sectigo went through rehoming their intermediaries. This was to show the Sectigo brand. Their Root CAs were due to expire in 2020.
Sectigo’s Documentation
Sectigo has a very nice document on this which does make a lot of sense. It does however seem to have some pieces that did not originally make sense. I was not quite left with enough warm fuzzies to leave it alone. You can read about it here. Their article lays a great foundation.
Cool Troubleshooting Tools
Not everyone is comfortable with using OpenSSL and inspecting certs manually. Here are a few of the cool tools I found along the way.
Certificate Decoder – Just plug in your PEM file contents and it will decode and give you the OpenSSL command to do so
crt.sh – Cool web portal to look up certificates based on thumbprint and other identifiers
SSL Labs – Server Test – If you want to see how your cert chain is trusted, this is one of the many things this site can do.
AddTrust External CA Root has been around since 2000 and well trusted. What happens when this expires?
Digging In
Running through SSL Labs is an easy way to see the cert paths that are trusted. One good hint at this is the cert chain that the server sends. It is why it is important to include the intermediaries on whatever device is terminating the certificate.
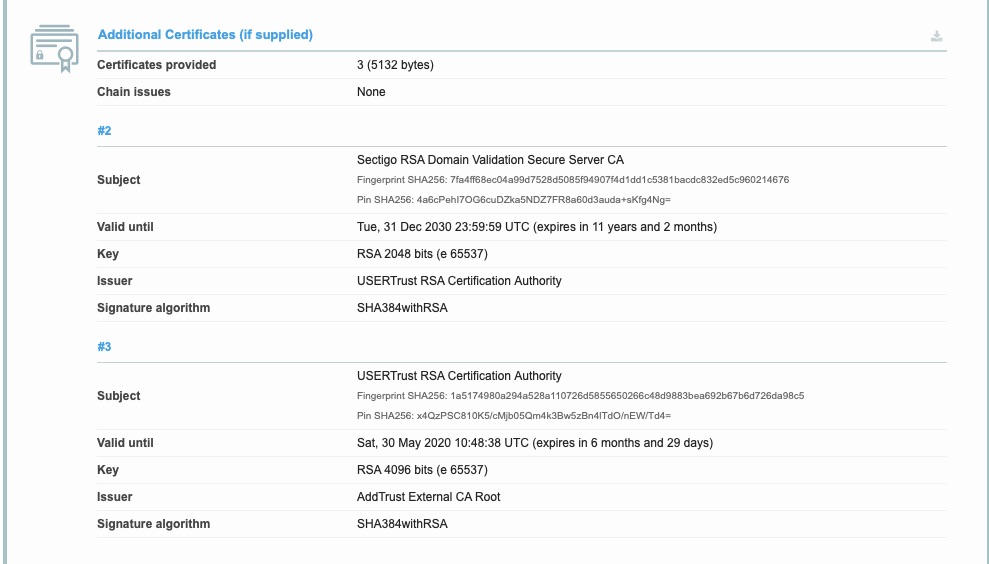
Provided Cert Chain
So far this looks normal but you can see that the “Valid until” on #3 is 30 May 2020.
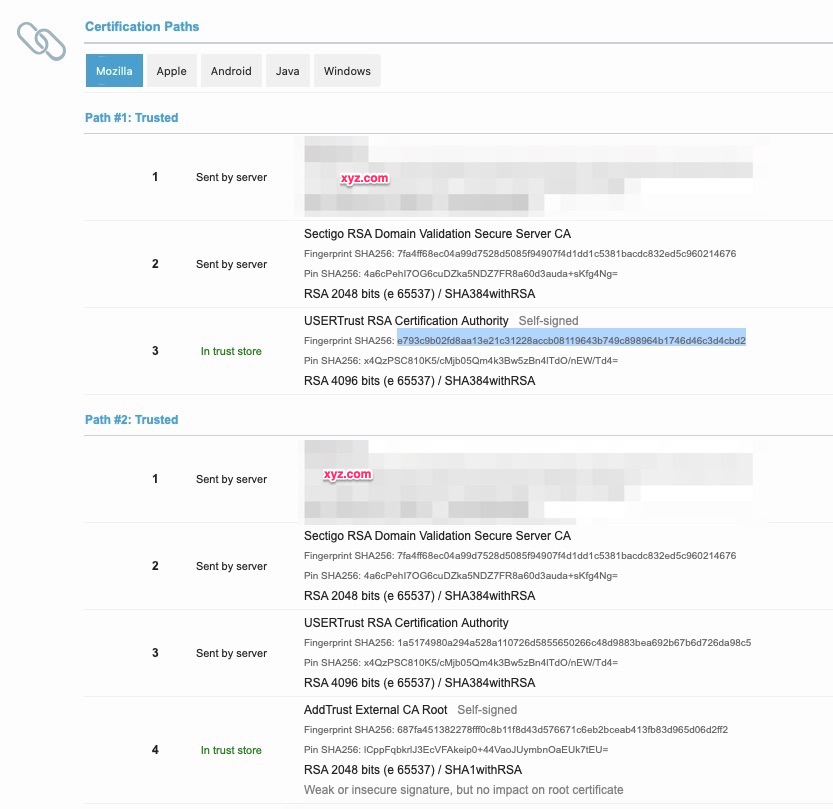
Trusted Cert Chain(s)
Here you can see there are two trusted paths. Path #2 is in line with the cert chain we are providing with the early expiration.
Path #1 appears short circuited. One may think the same “USERTrust RSA Certification Authority” may be trusted. Upon further inspection, they have a different fingerprint.
It appears that Sectigo is signing the certificates with an Intermediary chained to a Root that expires in 2020. Due to an intentional name collision, it also matches another Root that expires in 2038.
This is the part that seems to be omitted in most documentation is that there are two “USERTrust RSA Certification Authority” CAs. One that expires in 2020 and one that expires in 2038. At the expiration of 2020, that path should no longer be valid. It is likely browsers and operating systems are already picking the shorter cert path if they trust it.
Final Words
Per Sectigo’s article I linked to we see SSL Labs do exactly what was expected. As always you should test, particularly on systems that are older and do not automatically update their Root CAs.
Trust Chain Path A: AddTrust External CA Root [Root] USERTrust RSA Certification Authority (Intermediate) [Intermediate 2] Sectigo RSA DV/OV/EV Secure Server CA [Intermediate 1] End Entity [Leaf Certificate]
Trust Chain Path B: USERTrust RSA Certification Authority (Root CA) [Root] Sectigo RSA DV/OV/EV Secure Server CA [Intermediate 1] End Entity [Leaf Certificate]
The interesting tidbit on the Cross Signed Intermediary is
This intermediate certificate is signed with SHA384 hash algorithm, but the root certificate it depends on – AddTrust External CA Root – is signed in SHA1. This historical chain presents a high compatibility rate with old systems or browsers that cannot be updated. If you work with strict clients or systems that only accept full SHA256 (or more) certification chain, you can install the following chain on your server. It has the same name but it signed in SHA284: USERTrust RSA Certification Authority. Then the chain will be shortened and won’t include a SHA1-signed certificate anymore.
As you may have read previously in my CheckPoint R77 to R80 article – There are some fun nuances and slight changes. I did the first policy push on a Friday since upgrading to R80.20 on the Management Server. Monday afternoon some phones started having issues. At first I thought it was coincidental. Coincidences rarely happen though. SmartConsole Logging wasn’t reporting any drops.
How can a change delay days?
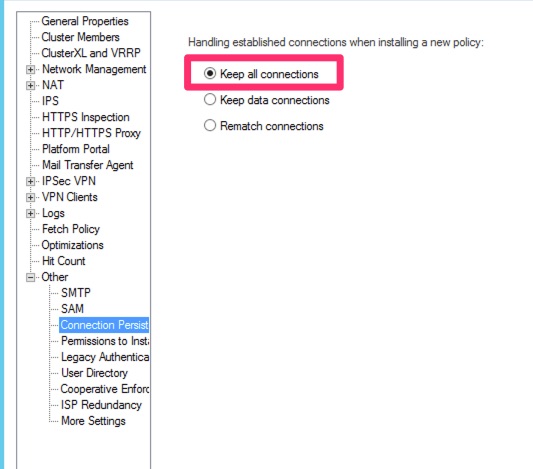
In our environment, instead of having CheckPoint rematch ACLs on Policy push, we accept all previously trusted connections. This helps avoid connections resetting after a policy push.
With this, already trusted TCP connections were allowed but new ones were being prevented and it took a few days for some of the phones to reset/reconnect and get blocked.
Logging
We log all traffic and blocks but this one was not reporting as dropped
I was even using the “fw ctl zdebug + drop” command and it reported no drops. SmartConsole reported it even accepting the TCP/1720 packet but it simply did not get routed from the ingress interface to egress interface.
I verified this by running tcpdump on the CheckPoint as well as further down machines and I could see the CheckPoint receiving the TCP/1720 but then went into a black hole.
The Fix
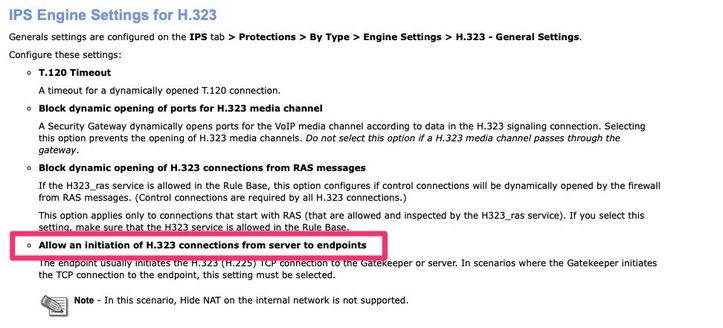
I was all set to enable H.323 Debugging when I came across this article and found it. Specifically this section
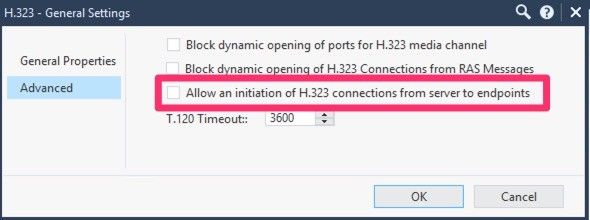
From all of my packet tracing this was the case. The Phones could register via UDP/1719 but when the GateKeeper would try to connect back to the phones over TCP/1720 the firewall accepted it but something else in CheckPoint was blocking it so it had to be H.323 inspection.
I went ahead and enabled this and bam, it started working!
Just add this to the list of fun nuances. I believe R77 was just more relaxed in this case about the inspection and in R80 they have tightened it up a bit.
The purpose of this article is just to describe how I did it. Not to imply that it is inherently difficult. For more on why check out the About page.
Where I Started From
I already had the domain woohoosvcs.com and the registrar was GoDaddy who was also hosting DNS. I decided I would host WordPress in Google Cloud due to my familiarity of it and already using G Suite. Therefore I did migrate my registrar to GoDaddy. I had thought I could do a CNAME DNS setup in CloudFlare as I walk through in my article https://blog.woohoosvcs.com/2019/10/beginners-guide-to-cloudflare/ but I was not ready for the Business Plan price tag of that and eventually moved my DNS to CloudFlare.
Why I Chose What I Chose
Due to work exposure I was very familiar with Google DNS, Google Cloud and CloudFlare so I decided to use those based on previous knowledge and price. GoDaddy was charging me $26/year whereas Google Registrar Services were $12 for the same domain. CloudFlare is between $0 and $20 depending on Free versus Professional Tier.
Google Cloud had an easy WordPress Template for a few scenarios but I chose hosted VM. Google was also offering a $300 credit on new activations which I happily opted for
To The Actual Topic!
DNS
So my first order of business was to move my DNS to CloudFlare. I was a bit reluctant as many may be. I just have one site I need protected by CloudFlare, why should I move my entire DNS there? Its a valid concern and why they have CNAME setup but on a pricier tier.
I have been doing this a while and remember when it used to take multiple days to change your nameservers. I changed registrars and then nameservers twice within a few days. The only reason it took so long is before moving to CloudFlare I decided to enable DNSSEC which I had to disable.
Cloud Flare
Once the nameservers were set to CloudFlare’s the setup nearly set it self up in CF with the exception of setting a few specifics I wanted, like requiring TLS 1.2 or higher.
Word Press on Google Cloud
This was just as easy as clicking the template and letting it deploy on a VM. I chose a VM due to the simplicity for myself to manage but I am fairly technical. I think Kubernetes or App Engine may be more difficult although they will scale much more in the long run more easily.
Cloud Flare TLS Cert
To allow it to work in TLS – Full mode though I needed to enable TLS on apache which is where it gets a bit technical.
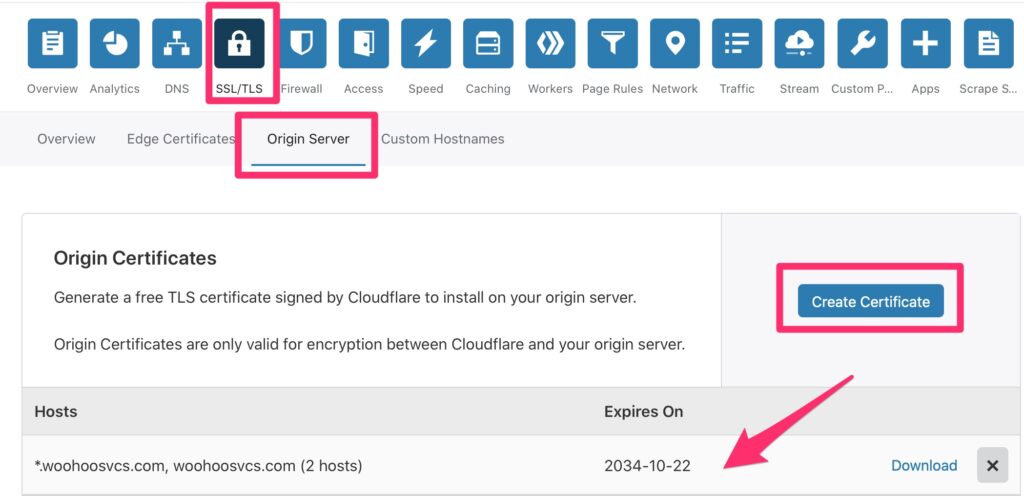
To do this, CloudFlare will generate an origin cert for you so you do not need to purchase one or an extra one but you can certainly use one if you purchased it.
WordPress TLS Cert
I then needed to edit a few things on the VM. The origin cert creation created a private key and certificate. Upon creation, please copy these down as you will have to re-generate if you need the private key again.
I put these in the following respective directories
At the very bottom of the page to generate the origin certs it had a link to download the trusted roots. These are needed so that Linux and WordPress trust it. These were placed in the following locations
Then run “update-ca-certificates” and it should rebuild the CA Directory that the local system trusts. WordPress however has its own copy of the ca file that you must copy over.
# Take a backup!
cp /var/www/html/wp-includes/certificates/ca-bundle.crt cp /var/www/html/wp-includes/certificates/ca-bundle.crt.orig

# Copy the system CA to WP
cp /etc/ssl/certs/ca-certificates.crt /var/www/html/wp-includes/certificates/ca-bundle.crt

# Append the site name to localhost in /etc/hosts
root@wordpress-1-vm:/var/www/html# cat /etc/hosts
127.0.0.1	localhost blog.woohoosvcs.com

# Edit Apache / WordPress site config
/etc/apache2/sites-enabled/wordpress.conf

<VirtualHost *:443>
    SSLEngine On
    SSLCertificateFile /etc/ssl/certs/blog.woohoosvcs.com.crt
    SSLCertificateKeyFile /etc/ssl/private/blog.woohoosvcs.com.key
    SSLCACertificateFile /etc/ssl/certs/ca-certificates.crt

    ServerAdmin [email protected]
    ServerName blog.woohoosvcs.com
    #ServerAlias www.example2.com #If using alternate names for a host
    DocumentRoot /var/www/html/
    #ErrorLog /var/www/html/example.com/log/error.log
    #CustomLog /var/www/html/example.com/log/access.log combined
</VirtualHost>


# Restart apache
systemctl restart apache2

# It should listen on 443 now

root@wordpress-1-vm:/var/www/html# netstat -an | egrep "443.*LISTEN"
tcp6       0      0 :::443                  :::*                    LISTEN
From here you can try to curl and see if it works – Log entry below is truncated to save space.
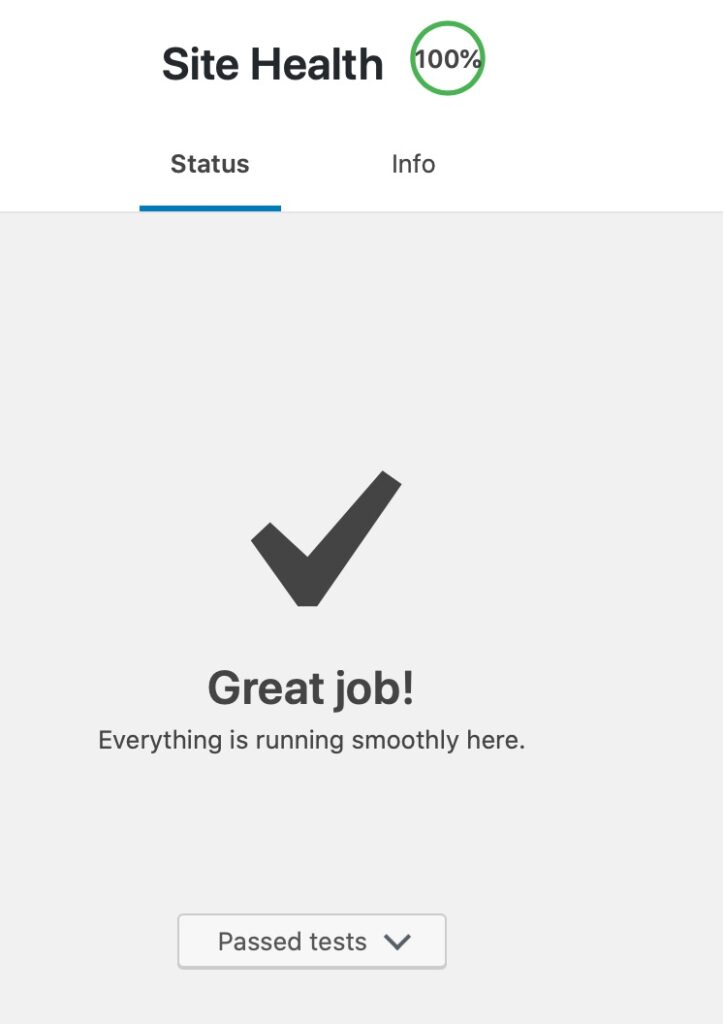
WordPress has a nice health check feature that can help you verify that comunication is great. This is under the Admin Page / Tools / Site Health
It took a bit to get here but I worked through the issues. One of them is the image deployed with Debian 9 which had an older PHP version (7.0) so I went through an in place upgrade to Debian 10 (not covered by this article)
Some of the problems I had while initially setting this up were loopback connections from the server itself and inaccessibility of the API when I changed the permlinks to “pretty”
I had to enable / Add the “Allow Override All” to my wordpress.conf file
<Directory /var/www/html>
  Options -Indexes
  AllowOverride All
</Directory>
Are we there yet?
At this point you should have a fairly secure and usable WordPress blog site. If you don’t want to go through all these hassles there are plenty of hosting providers but this only cost me $12/year for the registrar fees and $0-$20 a month for CloudFlare depending on whether I want the WAF enabled. Google Cloud on the $300 credit should last about a year and then be $30/month, if that for the VM hosting this.