Summary
Now that we’ve stood up a majority of the framework we can get to some of the fun stuff. Namely Kubernetes Dashboard. Due to compatibility reasons we will be using 2.0beta1. Newer 2.0 betas are not well tested and I ran into some issues with our 1.14 that Photon comes with.
Download and Install
This is short and sweet. As usual, I like to download and then install. I didn’t like the name of this file though so I renamed it.
curl -O https://raw.githubusercontent.com/kubernetes/dashboard/v2.0.0-beta1/aio/deploy/recommended.yaml

mv recommended.yaml dashboard-2b1.yaml

kubectl apply -f dashboard-2b1.yaml
namespace/kubernetes-dashboard created
serviceaccount/kubernetes-dashboard created
service/kubernetes-dashboard created
secret/kubernetes-dashboard-certs created
secret/kubernetes-dashboard-csrf created
secret/kubernetes-dashboard-key-holder created
configmap/kubernetes-dashboard-settings created
role.rbac.authorization.k8s.io/kubernetes-dashboard created
clusterrole.rbac.authorization.k8s.io/kubernetes-dashboard created
rolebinding.rbac.authorization.k8s.io/kubernetes-dashboard created
clusterrolebinding.rbac.authorization.k8s.io/kubernetes-dashboard created
deployment.apps/kubernetes-dashboard created
service/dashboard-metrics-scraper created
deployment.apps/kubernetes-metrics-scraper created
Health Check
The dashboard namespace is kubernetes-dashboard so we run the following.
root@kube-master [ ~/kube ]# kubectl get all --namespace=kubernetes-dashboard
NAME                                              READY   STATUS    RESTARTS   AGE
pod/kubernetes-dashboard-6f89577b77-pbngw         1/1     Running   0          27s
pod/kubernetes-metrics-scraper-79c9985bc6-kj6h5   1/1     Running   0          28s

NAME                                TYPE        CLUSTER-IP       EXTERNAL-IP   PORT(S)    AGE
service/dashboard-metrics-scraper   ClusterIP   10.254.189.11    <none>        8000/TCP   57s
service/kubernetes-dashboard        ClusterIP   10.254.127.216   <none>        443/TCP    61s

NAME                                         READY   UP-TO-DATE   AVAILABLE   AGE
deployment.apps/kubernetes-dashboard         1/1     1            1           57s
deployment.apps/kubernetes-metrics-scraper   1/1     1            1           57s

NAME                                                    DESIRED   CURRENT   READY   AGE
replicaset.apps/kubernetes-dashboard-6f89577b77         1         1         1       29s
replicaset.apps/kubernetes-metrics-scraper-79c9985bc6   1         1         1       29s
Connecting
On the main Dashboard page it indicates you can access via running “kubectl proxy” and access the URL. This is where it gets a little tricky. Not for us since we have flannel working, even on the master. Simply download the Kubernetes kubectl client for your OS and run it locally.
dwcjr@Davids-MacBook-Pro ~ % kubectl proxy
Starting to serve on 127.0.0.1:8001
Now access the indicated link in the article. Namespace changed as it changed in 2.0 – http://localhost:8001/api/v1/namespaces/kubernetes-dashboard/services/https:kubernetes-dashboard:/proxy/
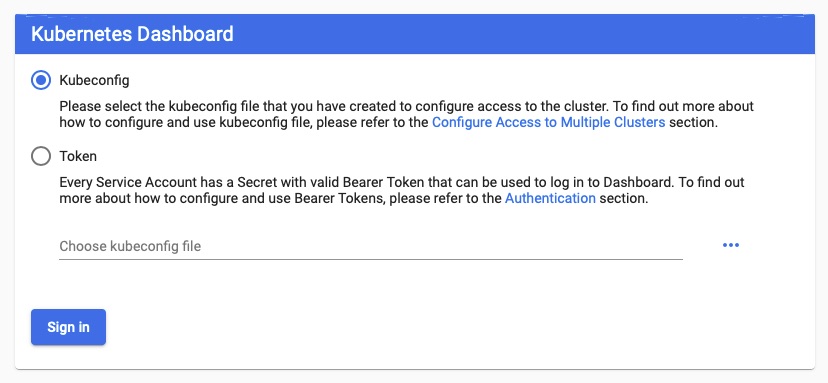
Authenticating
Kubernetes Access Control page does a good job at describing this but at a high level
Create an dashboard-adminuser.yaml
apiVersion: v1
kind: ServiceAccount
metadata:
  name: admin-user
  namespace: kubernetes-dashboard

apiVersion: rbac.authorization.k8s.io/v1
kind: ClusterRoleBinding
metadata:
  name: admin-user
roleRef:
  apiGroup: rbac.authorization.k8s.io
  kind: ClusterRole
  name: cluster-admin
subjects:
- kind: ServiceAccount
  name: admin-user
  namespace: kubernetes-dashboard
kubectl apply -f dashboard-adminuser.yaml
Then use this cool snippet to find the token. If you’re doing this on the master, make sure to install awk
kubectl -n kubernetes-dashboard describe secret $(kubectl -n kubernetes-dashboard get secret | grep admin-user | awk '{print $1}')At the bottom of the output should be a token section that you can plug into the token request.
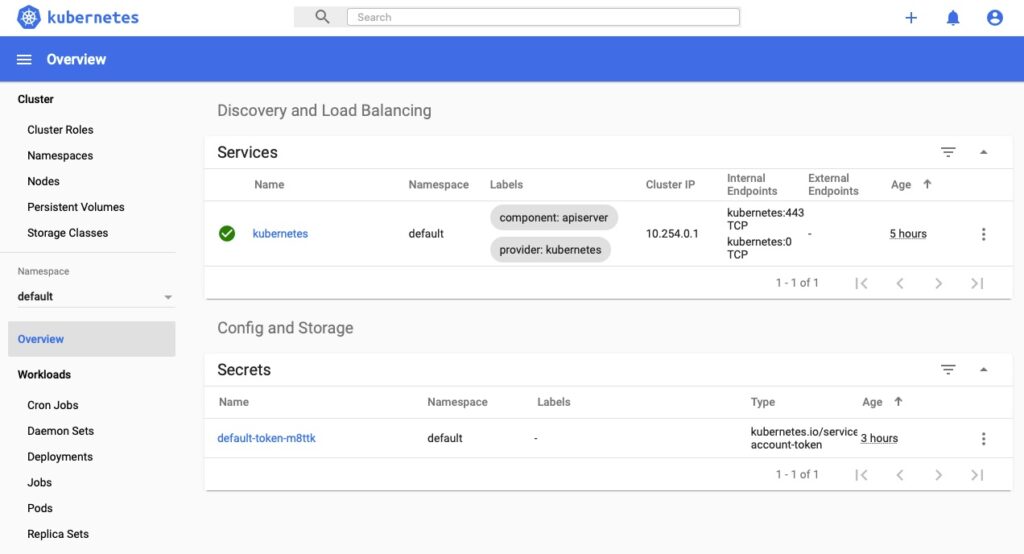
From here you’ve made it. Things just got a whole lot easier if you’re a visual learner!
Final Words
I may write a few more articles on this but that this point we have a very functional Kubernetes Cluster that can deploy apps given we throw enough resources at the VMs. Other topics that need to be covered are networking and the actual topology. I feel that one of the best ways to learn a platform or technology is to push through a guided install and then understand what the components are. This works for me but not everyone.