Going down a reading rabbit hole, I recently read Team of Teams: New Rules of Engagement for a Complex World by General Stanley McChrystal. I was not sure what I was in for with this. Paraphrasing what General Stanley McChrystal wrote, while he was going through the events in the book, he was not sure if what he experienced was a fluke or there was something more to it.
While this article is not a review as there are plenty around, this book did start to move me. I started thinking about other applicable lenses to view this through. In the book, the automotive industry is cited a couple of times. This opened Pandora’s box for me. In it, one of the examples was the GM Ignition Recall that took nearly 10 years to have fixed for a $2 part. Ultimately it was an organizational structure failure. The low level teams had known about this months after the new ignition switches were sent out into the wild and reports had started coming back.
Why Tesla?
It is easy to get wrapped up in the politics and public displays for which Elon Musk is known. Setting that aside, what Tesla is doing is revolutionary for a few reasons. In these times, it is extremely hard to start a new automobile company. Tesla not only a new automobile company but using a fuel source that is not industry standard.
Tesla is different. They are not just an automobile manufacturing company. Elon himself in numerous interviews cites that Tesla is actually a “hardcore” engineering company. They manufacture numerous parts for the vehicle in house as well as write all of the software (Software Engineering).
Outside the scope of this article, they’re also a data mining company. They have driving details on now millions of their vehicles. This has various uses such as road mapping, driving patterns and improving their autonomous driving.
How Legacy Automotive Companies Operate
Many of the legacy automotive manufacturers are extremely siloed using the “reductionist” methodology of breaking down areas into small teams and pushing them for efficiency. There are many different vendors that make components for legacy car companies. They build them to the Original Equipment Manufacturers specifications to ensure interoperability. These vendors do not typically communicate with each other or all of them to understand the whole picture. What this means is that the Engine Control Module (ECM) may be manufactured by one company and the Transmission Control Module (TCM) may be manufactured by another. The software may then be subcontracted out by those vendors. They use interoperability standards but may have little idea of how the Battery Control Module (BCM) interacts with these two modules.
This allows scale and efficiency. Vendor management is a very strong tool to help mitigate concerns. Many, like Toyota are great at this. They many times will have supply manufacturing happen in the same plant as the cars are assembled. Contracts also tend to indicate suppliers have a certain stock of supplies to weather temporary supply chain issues.
How Tesla Operates?
Many of its key components are manufactured in house, such as its seats. This is not to say it does not outsource any manufacturing. It certainly does. One critical piece that Telsa handles in house is to write its own software. This was instrumental in its adaptability during the computer chip shortages of 2020 and onward.
Chip Shortage
During the chip shortages, OEMs could not get their hands on chips. Many of the big ones had lots filled with unfinished vehicles. They were simply waiting on chips to arrive with no end in sight. Cars were delivered without features, in many cases.
Tesla did deal with a delay in production because of this. Its adaptability in writing its software, allowed it to utilize chips that were available. Not only did it adapt its software, Tesla realized it could in some cases reduce the need for some of them. This is very well documented in https://www.utilitydive.com/news/tesla-chip-semiconductor-shortage/628150/
Wrapping it Up
Traditional car manufacturers are very siloed. They are built this way for efficiency and scalability. With this, they are very inflexible and not very adaptable. Many of them are struggling to become profitable on their Electric Vehicles (EVs). Recently even Ford has started to bring its software development in house. This allows for constant updates that are needed without ever having to go into the dealership. Many of the Tesla recalls have been corrected via OTA (Over the Air) updates to software.
Conclusion
In a modern world of complexity, teams cannot work in isolation. They need to be aware of what other teams are doing to have a shared vision. Cognitive load needs to be minimized or information overload will occur but in this new world of complexity and constant information, silos do not work.
Building on the prior article of Fedora CoreOS + Ansible => K8s we want complete Infrastructure As Code. The newest way of doing this is GitOps where nearly everything is controlled by SCM. For that, flux is one of my favorites but Argo will also work.
The benefit of GitOps and K8s is that developers can have complete but indirect access to various environments. This makes it really easy for a DevOps team to provision the tooling very easily to either spin up environments effortlessly or let the developers do it themselves. That helps us get close to Platform Engineering.
Flux GitOps Repo
For this article, this is the tagged version of the GitOps repo used. At its core, we manually generated the yaml manifests via scripts commands. Namely upgrade_cluster1.sh and generate_cluster1.sh. Combined these create the yaml manifests needed. Upgrade cluster can be run to refresh the yaml during an upgrade but do not let it trick you. It can also be used to generate the initial component yaml. The generate_cluster1.sh should only need to be run once.
The flux cli has a bootstrap command that can be used but for this, we want disposable K8s clusters that can be torn down and then new ones rebuilt and attached to the same repo. Not only does this allow the workloads running to be treated like cattle but also the infrastructure itself.
To achieve this, we are manually creating the yaml manifests (still using the supported CLI tools) but decoupling that from the initial setup, deploy and running of the environment.
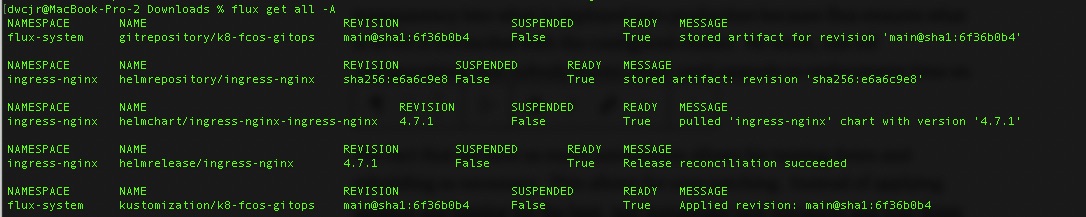
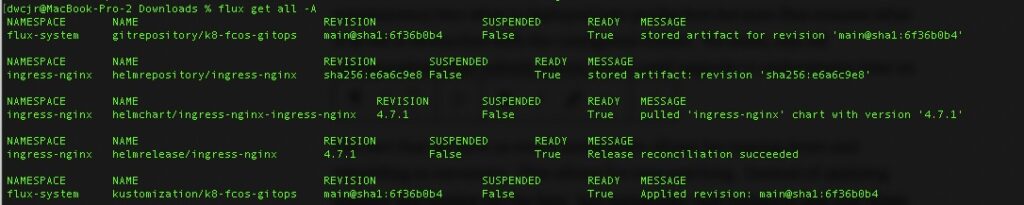
What Did We Get?
From a simple set of changes to pull and deploy flux, we have a sample ingress controller (nginx). In it you can specify any parameter about it and have clear visibility as to what is deployed. In this scenario we are just specifying the version but we could also specify how many instances or whether to deploy via daemonset (one instance per worker node).
Wrapping It All Up – What Is The Big Deal?
It might be a natural question as to what is the big deal about K8s, IaC, GitOps and this entire ecosystem. True IaC combined with GitOps allows complete transparency into what is deployed into production because flux ensures what is in Git is reconciled with the configured cluster. No more, one off configurations that nobody knows about until upgrade to replacement time on the server.
The fact that we have so much automation allows for tearing down and rebuilding as necessary. This allows for easy patching. Instead of applying updates and hoping for the best, just instantiate new instances and tear down the old ones.
Kubernetes is a personal passion of mine and I have written a few times about how to standup one of my favorite Container Optimized Operating Systems, PhotonOS. Most recently I wanted to rebuild my lab because it has been a while. While some of my prior posts have served as a Standard Operating Procedure for how to do it, its lost its luster doing it manually.
Because of this, I sought out to automate the deployment of PhotonOS with Ansible. Having already learned and written about SaltStack, I wanted to tool around with Ansible. I thought, great, Photon is highly orchestrated by VMware, this should be simple.
Unfortunately PhotonOS 5 does not work well with Ansible, namely due to the package manager.
Container Optimized Operating Systems
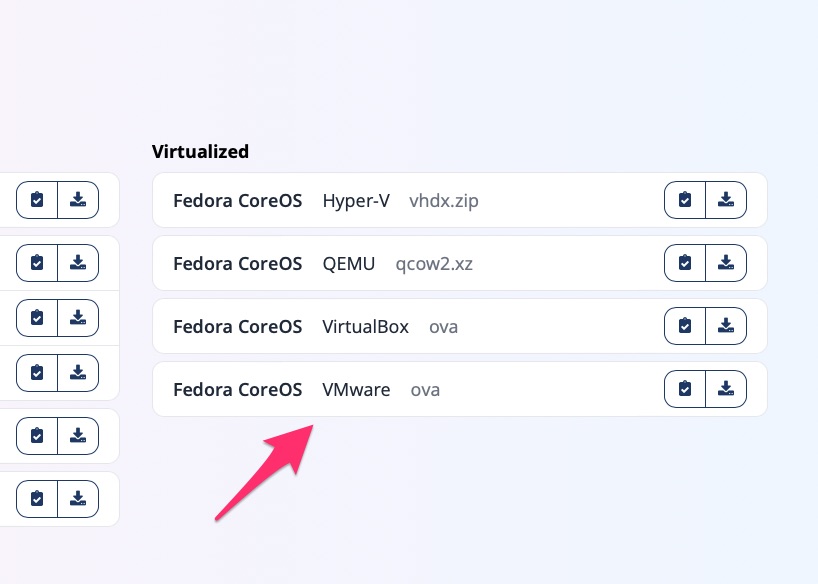
In my search for one that did work well with Ansible, I came across a few. Flatcar was the first. It seemed to have plenty of options. I think came across Fedora CoreOS. These seem to be two of many forks of an older “CoreOS” distribution. Since Ansible and Fedora fall under the RedHat umbrella, I went with FCOS.
The interesting thing about Flatcar and CoreOS is that they use Ignition (and Butane) for bootstrapping. This allows for first time boot provisioning. This is the primary method for adding authentication such as ssh keys.
My Lab
My lab consists of VMware Fusion since I’m on a Mac. For that a lot of my steps are specific to that but I attempted to make them generic enough so that it could be modified for your environment.
To help ensure your ssh keys are put into the environment, you’ll need to update butane with the appropriate details. Particularly the section “ssh_authorized_keys”
Butane is a yaml based format that is designed to be human read/writable. Ignition is designed to be human readable but not easily writable. For that reason, we use a conversion tool to help.
For this I scripted it via ovf.sh that instantiates it for a given number of instances. As documented, its 2 nodes, fcos-node01 and fcos-node02
Once they are done and powered one, along with a 45 second pause/sleep, we’re good to run Ansible and get the cluster going.
Running Ansible
Because I can be lazy, I created a shell script called k8s-fcos-playbook.sh that runs the playbook. At this point, sit back and enjoy the wait.
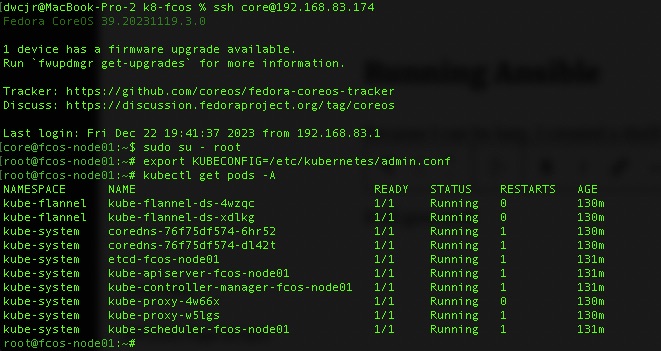
If all goes well you’ll have a list of pods up and running successfully and a bare bones cluster.
kubectl get pods -A
Concluding thoughts
While I did not go specifically into Ansible and the details, it is a public repository and written in a fairly self explanatory way. It’s not the best or most modular but is easy to follow.
Special Thanks!
A special thanks to Péter Vámos and his repository on doing this similarly. He gave me some great ideas, although some of it I went in a different direction.
The purpose of this article is to walk through bootstrapping a CA for Kubernetes clusters for use in the ingresses and other possible needs like a private docker repository. For this we will use https://cert-manager.io. We will assume you have an operational K8 cluster/node but if not check out https://blog.woohoosvcs.com/2023/06/photon-os-5-0-kubernetes-1-25/ on how to do that.
Use Case
A really good use case for this is when you want to use self-signed certificates in your lab but want the browser to trust it. For certificates to work, they require FQDNs. One could certainly have host file entries for every endpoint they need but I recently came across a more elegant solution “localdev.me”. This was referenced in a few places but namely https://kubernetes.github.io/ingress-nginx/deploy/
The beauty of localdev.me is that any subdomain resolves to 127.0.0.1 so you can easily run
To forward all of your ingresses to localhost. Its a neat trick and in today’s world we want to test TLS encryption using HTTPS.
Requirements
For this, we simply need to install cert-manager. There are two main ways. kubectl apply or using the Helm Chart. If you’re not familiar with Helm, please go down that rabbit hole. For this we’ll assume you are just running kubectl apply.
With any luck you will have some cert-manager related pods running
% kubectl get pods -n cert-manager
NAME                                      READY   STATUS    RESTARTS   AGE
cert-manager-559b5d5b7d-tq7rt             1/1     Running   0          29s
cert-manager-cainjector-f5c6565d4-vv652   1/1     Running   0          29s
cert-manager-webhook-5f44bc85f4-qkg7s     1/1     Running   0          29s
What Next?
Cert-Manager is a fairly extensible framework. It can connect to ACME compatible authorities to request and process certificate creation and renewals but for this we will be using two other configurations for it. We will be using the “CA” ClusterIssuer. In order to bootstrap a CA though we also have to use the “SelfSigned” Issuer.
Show Me the YAML
At the beginning is a Self signed issuer. What this means in our case is that the certificate’s common name matches the issuer name. You will find this in any public certificate authority root as well. There are two types of “issuers” in cert-manager. An “Issuer” which is namespaced and can only issue for that namespace and a “ClusterIssuer” which can issue for the cluster. For labs I like to use ClusterIssuers so do not need to have multiple issuers.
Certificates are namespaced though. My preference is to have a wildcard certificate in each namespace but you can also have the ingress request certificates.
Here we are requesting a root certificate that will expire in 5 years. We can’t swap these out too regularly because its a pain getting our OS and other tools to trust them. In the issuerRef we see the self-signed-issuer referenced with many other attributes we’ll use later.
Then we need to create a cluster issuer for the certificates we want to issue. We tell it to use the ca root-secret for the chain.
Next we will issue a certificate in a namespace that will chain off the self-signed root. It is namespaced to the sandbox namespace. They will expire after 90 days and renew 15 days before expiration.
Make sure to create the sandbox namespace first if you want to use this or change it to the namespace you want.
apiVersion: cert-manager.io/v1
kind: Certificate
metadata:
  name: localdev-me
  namespace: sandbox
spec:
  # Secret names are always required.
  secretName: localdev-me-tls

  # Secret template is optional. If set, these annotations
  # and labels will be copied to the secret named example-com-tls.

  # Note: Labels and annotations from the template are only synced to the Secret at the time when the certificate
  # is created or renewed. Currently labels and annotations can only be added, but not removed. Removing any
  # labels or annotations from the template or removing the template itself will have no effect.
  # See https://github.com/cert-manager/cert-manager/issues/4292.
  secretTemplate:
    annotations:
      my-secret-annotation-1: "foo"
      my-secret-annotation-2: "bar"
    labels:
      my-secret-label: foo

  duration: 2160h # 90d
  renewBefore: 360h # 15d
  subject:
    organizations:
      - Woohoo Services
  # The use of the common name field has been deprecated since 2000 and is
  # discouraged from being used.
  commonName: localdev.me
  isCA: false
  privateKey:
    algorithm: RSA
    encoding: PKCS1
    size: 2048
  usages:
    - server auth
    - client auth
  # At least one of a DNS Name, URI, or IP address is required.
  dnsNames:
    - localdev.me
    - "*.localdev.me"
  # Issuer references are always required.
  issuerRef:
    name: my-ca-cluster-issuer
    # We can reference ClusterIssuers by changing the kind here.
    # The default value is Issuer (i.e. a locally namespaced Issuer)
    kind: ClusterIssuer
    # This is optional since cert-manager will default to this value however
    # if you are using an external issuer, change this to that issuer group.
    group: cert-manager.io
We now have a wildcard certificate for use in the sandbox namespace
You may be wondering, great but how do I get my browser to trust this? You’re right, this is essentially an untrusted certificate chain. We need to base64decode the ca.crt section and then import it into a few places. The most important is your OS/browser so that it trusts the root.
There may be cases where you need your Kubernetes cluster to trust it as well. That will depend on your distribution but for Photon running a stock K8 distribution its fairly trivial.
You’ll simply put a copy in /etc/ssl/certs/ using a unique name. You will need “openssl-c_rehash” as mentioned in https://github.com/vmware/photon/issues/592 to be able to get the OS to trust it.
You will also want to add the PEM to /etc/docker/certs.d/ so that docker itself (or containerd) trusts it. You will need to restart docker/containerd to get it to accept the cert though. The use case for this is that if you want to mount the certificate in the private repository doing something like this you can. In this case the kubelet on the kubernetes node will call docker/containerd and that will need to trust the certificate.
There you have it. A cluster wide CA that you can have your K8 nodes and local machine trust for TLS encryption. Once setup in this manner it makes it easy and portable to using something like letsencrypt when going to production because most of the framework and configuration is there and has been tested.
It is 2023 and a lot has changed since my prior Photon OS and Kubernetes posts. Some things have become much easier but also things have changed such as the migration from docker/dockershim to containerd.
For the VM specifications, you will need at least 2 cores to run the control plane. I set my lab up with 2 cores, 4GB RAM and 30GB HDD.
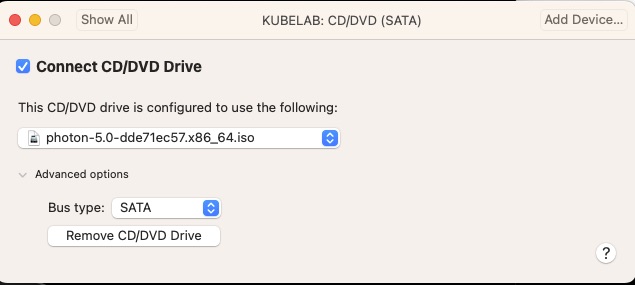
My local fusion defaults to an IDE for the CD/DVD and Photon OS 5.0 does not do well with that and recommends changing it to SATA.
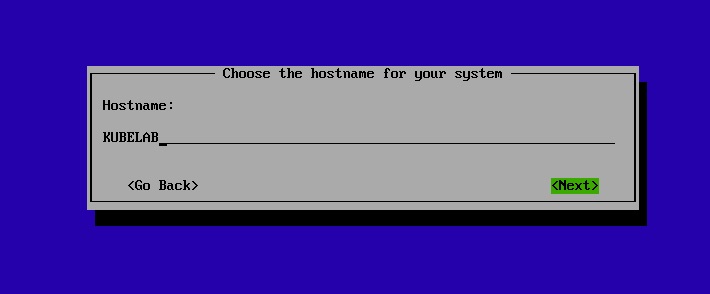
After boot into the ISO, just a few simple questions and we’re off! For my lab I’m naming it KUBELAB
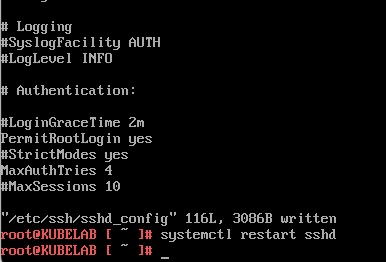
Once booted, I prefer to access via SSH and since only a root user has been provisioned I will allow root logins via ssh by editing /etc/ssh/sshd_config
For this, we’re choosing 1.25.11-0 as I’ve exhaustively tested it for the series I am doing. Once installed, we want to disable the /etc/yum.repos.d/kubernetes.repo by setting “enabled=0” so that OS updates do not push Kubernetes update as we want to control that.
After doing that let’s update the OS packages. But first let’s remove docker we not use containerd
# We are using containerd now
tdnf remove docker*

# OS Updates
tdnf --refresh update
Before we reboot there are a few tried and true settings we’ll want to update.
In /etc/sysctl.d/90-kubernetes.conf
# These are required for it to work properly
net.bridge.bridge-nf-call-iptables = 1
net.bridge.bridge-nf-call-ip6tables = 1
net.ipv4.ip_forward = 1
# This helps an issue later on when we get into running promtail
fs.inotify.max_user_instances = 256
In /etc/modules-load.d/20-kubernetes.conf
# Required to allow the basic networking to work
br_netfilter
In /etc/security/limits.conf
# Bump up the default of 1024 max open files per process to 10000
* hard nofile 10000
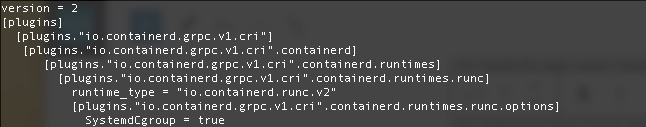
In /etc/containerd/config.toml
version = 2
[plugins]
[plugins."io.containerd.grpc.v1.cri"]
[plugins."io.containerd.grpc.v1.cri".containerd]
[plugins."io.containerd.grpc.v1.cri".containerd.runtimes]
[plugins."io.containerd.grpc.v1.cri".containerd.runtimes.runc]
runtime_type = "io.containerd.runc.v2"
[plugins."io.containerd.grpc.v1.cri".containerd.runtimes.runc.options]
SystemdCgroup = true
In /etc/crictl.yaml
runtime-endpoint: "unix:///run/containerd/containerd.sock"
image-endpoint: "unix:///run/containerd/containerd.sock"
timeout: 0
debug: false
pull-image-on-create: false
disable-pull-on-run: false
In /etc/hosts
# Change the localhost binding to the IP of the VM
# Without this kubectl get node - won't show ready
#127.0.0.1 KUBELAB
192.168.83.170 KUBELAB
The config.tomly should look like this.
Now we reboot!
Initialize The Cluster
For this we will run the following with –pod-network-cidr. This is the default for flannel which we’ll use for ease.
# Allow kubelet to start when kubeadm init allows it
systemctl enable kubelet.service

# Initialize - this may take a while as the pods are pulled down
kubeadm init --pod-network-cidr=10.244.0.0/16
This will take 5-10 minutes, maybe longer depending on your internet connection. When you come back with any luck you’ll see success!!!
follow the steps listed.
mkdir -p $HOME/.kube
cp -i /etc/kubernetes/admin.conf $HOME/.kube/config
chown $(id -u):$(id -g) $HOME/.kube/config

# Check to see if pods are up!
root@KUBELAB [ ~ ]# kubectl get pods -A
NAMESPACE     NAME                              READY   STATUS    RESTARTS   AGE
kube-system   coredns-565d847f94-6gmrp          0/1     Pending   0          2m31s
kube-system   coredns-565d847f94-wrvqk          0/1     Pending   0          2m31s
kube-system   etcd-kubelab                      1/1     Running   0          2m46s
kube-system   kube-apiserver-kubelab            1/1     Running   0          2m44s
kube-system   kube-controller-manager-kubelab   1/1     Running   0          2m46s
kube-system   kube-proxy-g9kpj                  1/1     Running   0          2m31s
kube-system   kube-scheduler-kubelab            1/1     Running   0          2m44s
Almost there
The cluster(single node) is up but we still need networking which we’ll use Flannel and to remove a taint to allow scheduling on the control plane since this will be a single node lab with control plane and worker nodes on the same VM.
# Reference https://github.com/flannel-io/flannel
# Apply the flannel network overlay
kubectl apply -f https://github.com/flannel-io/flannel/releases/latest/download/kube-flannel.yml
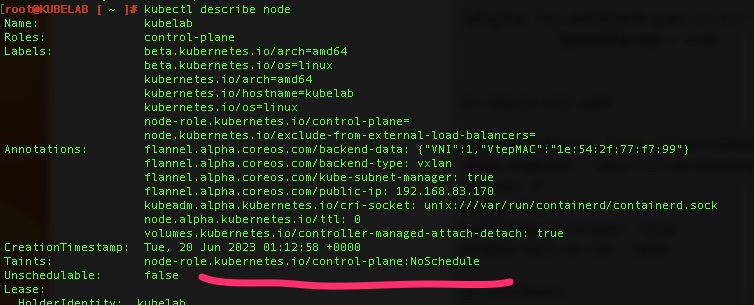
# Remove the taint - the minus removes it
kubectl taint nodes kubelab node-role.kubernetes.io/control-plane:NoSchedule-
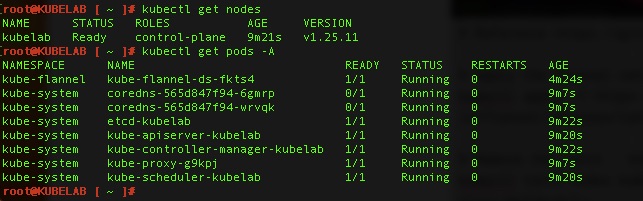
Validations!
By running kubectl get pods -A and kubectl get nodes – we can see pods are running and the node is “Ready”
Today I had my first Tesla Service Center visit. Rewinding a bit my Tesla journey started on 8/2/21 when I decided to downsize my Yukon and make the plunge into an EV. Fast forward a few months of constantly watching the Estimated Delivery Date and finally receiving ownership on 11/12/2021. The car has been great to drive but over the holidays I started getting a strange error.
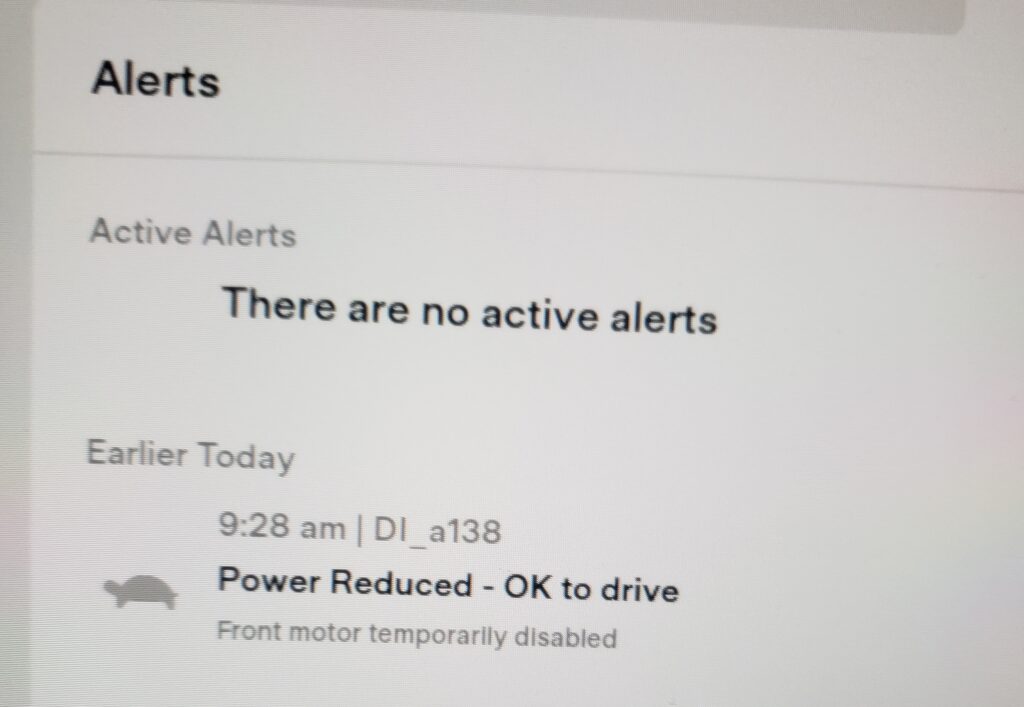
The Error – DI_a138
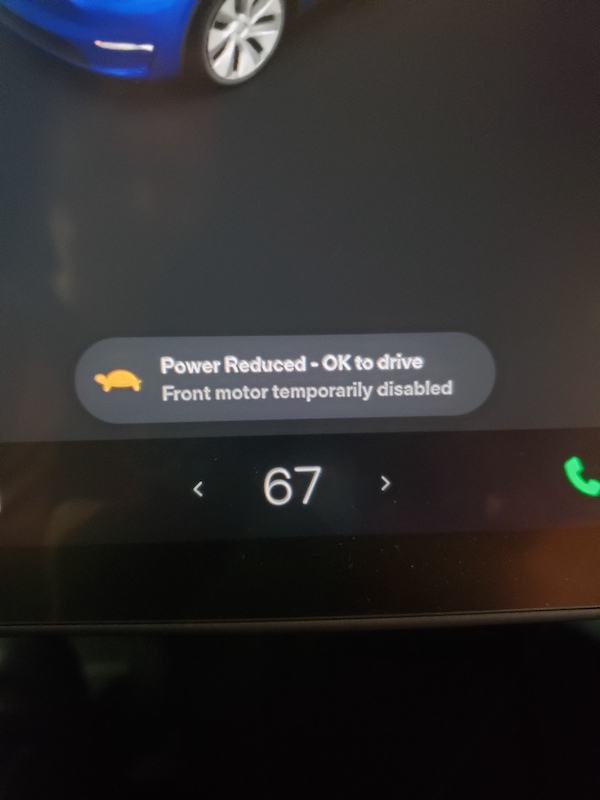
On 12/29/2021 I pulled my Model Y out of the garage and helped my mother in law in to take to the doctors. After getting back in and putting into park I received a strange error.
Power Reduced – OK to drive Front motor temporarily disabled DI_a138
Power Reduced – OK to drive Front motor temporarily disabledDI_a138 Power Reduced – OK to drive
I figured this was just a fluke but created a technical support case with Tesla on it via https://www.tesla.com/support. They checked and did not see anything but recommended I create a Service Appointment to request a virtual diagnostic if it persisted. It did and I did!
The Visit
After some back and forth chatting on the app, it was requested I drop off the vehicle early before the scheduled appointment for this issue to diagnose the drive unit and it would need to be there for 72-96 hours. I had hoped more could be done virtually but I got it and brought it in.
I spoke with the Service Advisor and he consulted with the lead tech. The Service Advisor then told me he had great news. They had already pulled logs and were ordering a new drive unit just incase and I was free to go with my vehicle and would not need to come back until further notice, likely when parts arrived.
This was really neat. I’ve heard the service visits being a mixed bag. Many times on the groups you only hear complaints but in the marketing materials you hear AI powering automatic parts ordering and virtual diagnosis. In this case while it would have been nice to save the drive I didn’t mind it. It also also nice for them not to need to keep my vehicle until parts arrived, particularly with the shortages happening these days.
More DI_a138 Details
So this was an interesting one. There is a higher probability of this happening when running errands sometimes and quick in and outs. This never happens on a “cold” drive where the car has sat for a bit. It appears that when some pre-drive check is done on the drive unit. It hits an error it doesn’t understand or some safety check and shuts down the front motor.
After finding some other articles in this happening in the past I realized I could just get out and back in and it goes away and drives with both motors enabled.
In some Model 3’s and Y’s from 2019 and 2020 there was a glitch where the motor needed to vent heat and it got confused. If this is the case it may just be a regression on the latest software. At this time it is 2021.44.30
Updates
As I hear more I’ll update this article but overall a great first experience with the service center.
1/19/2022 – Brought it in this morning and the short version is known firmware issue that’s now fixed.
“Performed diagnostics for front drive unit, Performed inspections of harness and all connectors and connector pins. No issues found. This was a past firmware issue that has been resolved with firmware 2021.44.30.6 and vehicle is now 1 firmware higher. test drove vehicle to verify no further issues.”
It seem every week we see a new article of some sort of IT security related incident. While many of these larger companies tend to have security tools to help combat them, many smaller companies do not know where to start. An eye opening experience would be to run an internal vulnerability scan on your corporate network to see what types of vulnerabilities you have.
These scans results may then drive you to more promptly patch and mitigate vulnerabilities. Other times it can help give data to management to ask for resources like security tools and people to manage them.
What is This Article?
This article is a quick and dirty install guide for installing Greenbone Vulnerability Management on Kali Linux. Both have been around for quite some time and are free to install. You can attempt to install Greenbone on any Linux distrubution but Kali tends to be the easier and more stable platform since its very commonly used for vulnerability scanning and management.
A Server (Physical or VM) to install that has 2GB RAM, 1 Core and 20GB HDD space
Basic understanding of installing Linux
Installing Kali Linux
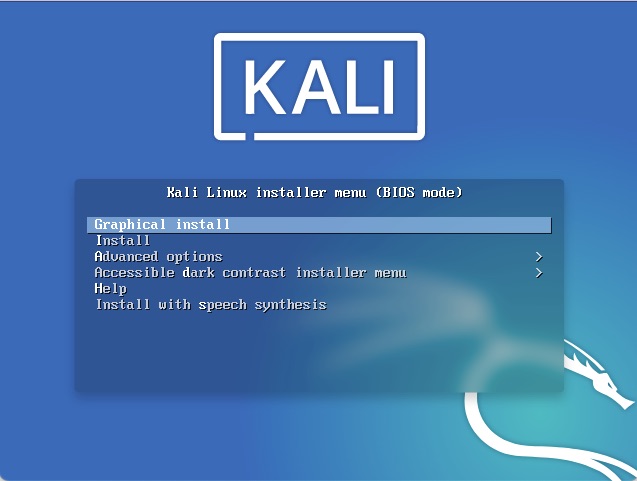
We won’t get too much into the details of this but if you’re a first time installer, select the Graphical Install and you can’t go too wrong with most of the defaults.
Kali Linux – Install
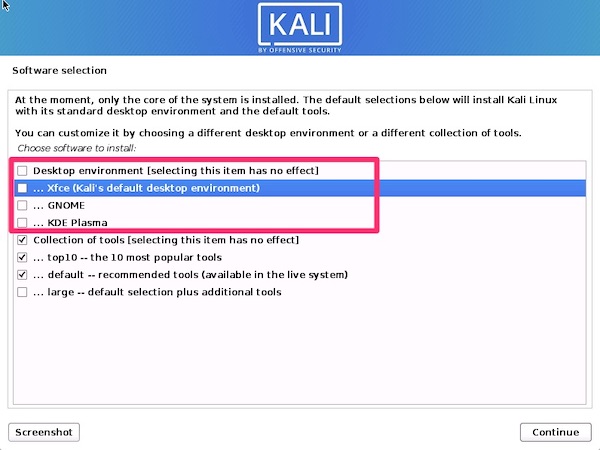
You can install a Desktop but for the purpose of this tutorial, I’ll be using command line so I unselected the Desktops. It saves space and a little compute.
Kali – Desktop Environment
Prepping for Greenbone Vulnerability Management
I always like to start out with a freshly updated operating system. Since Kali is based off Debian we’ll be using apt-get. The first step is to configure network access.
# This will tell us the interface name, most likely eth0
ifconfig -a
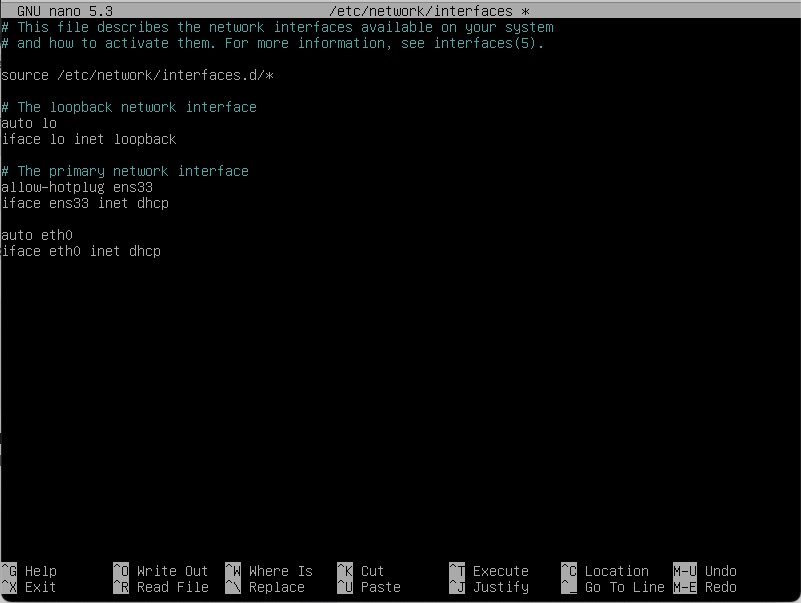
# This will allow us to edit the interfaces file
sudo nano /etc/network/interfaces
We can then populate it with eth0 information for DHCP
sudo nano /etc/network/interfaces
The new lines are the “auto eth0” and “iface eth0 inet dhcp”.
Control X to save and then a “sudo systemctl restart networking” and your ifconfig -a should show an ip address for eth0.
From here we can update the system. Its always best to update before the install to ensure you’re running the latest fixes.
# We're going to switch to root since the next few commands will need to be under that context
sudo su - root

# This command updates the package metadata
apt-get update

# This command performs the actual update
apt-get upgrade

# Reboot when done to start fresh (optional but should be done at some point)
reboot
Depending on your internet connection, this could take a few minutes.
Installing and GVM
Installing is the simplest part.
sudo apt-get install gvm
And wait a few minutes after answering “Y” to download and install.
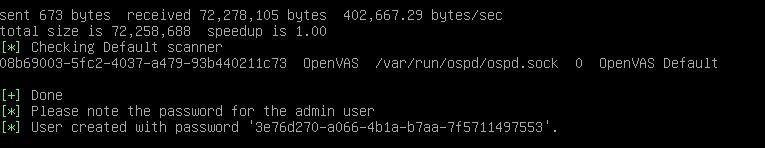
Next we’ll run “sudo gvm-setup” which aside from running through the configuration will start pulling down the various feeds. This will take a good 30-40 minutes. It does an rsync on community feeds for CVEs, Vulnerabilities and other scanner options.
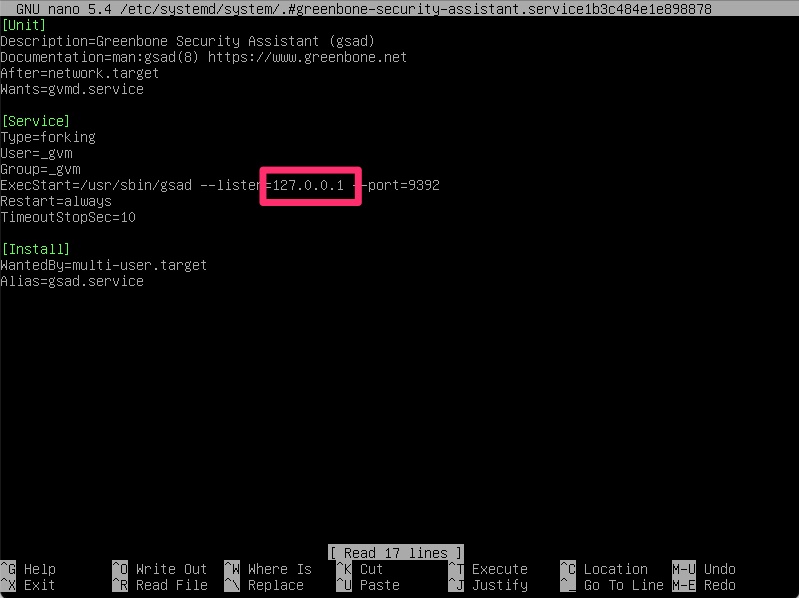
Once it has completed this process, we do need to modify it to listen on 0.0.0.0 instead of 127.0.0.1 so that it is network accessible. Before that though it will output the admin username and password which we need to capture before proceeding. It is randomized for every install and since this install will get blown away after this lab, I’ll share it unfiltered.
Kali -GVM – Password
We can do that by running the following to edit the systemd startup file
From here a “sudo gvm-start” is all that is needed.
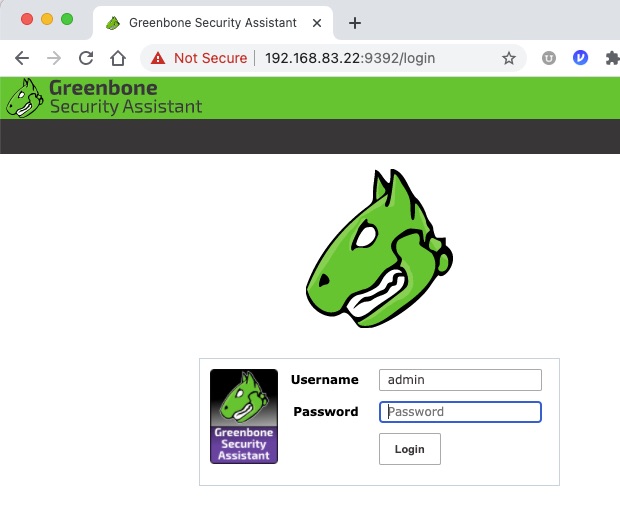
If all went well you should be able to https:// to the IP of the server on port 9392
With any luck aside from a certificate error the following screen should show up.
gsa – login
Configuring a Scan
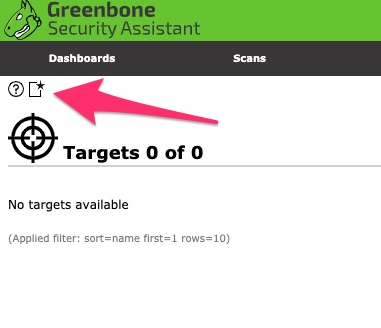
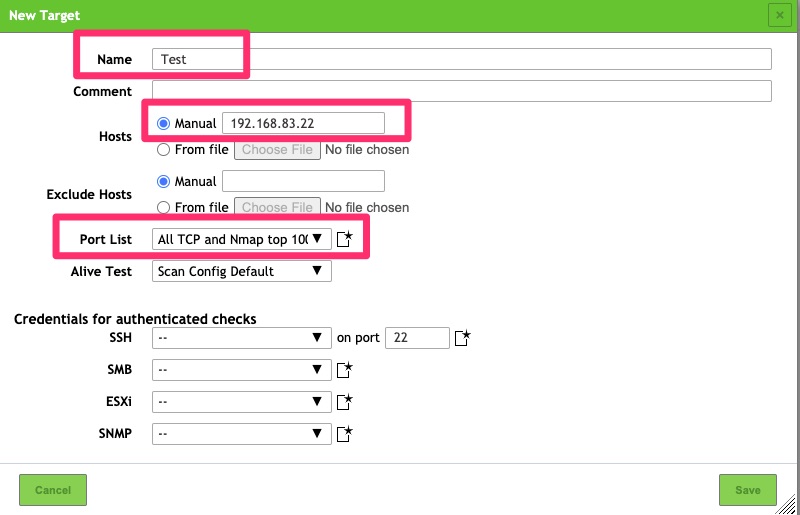
Now that we have access to the tool, we need to configure a scan. This starts with configuring a target list. Under Configuration / Targets. Then create a new target
gsa – target – newgsa – new -target
This requires just a few fields entered. The name is fairly self explanatory and is just a name for the targets to be scanned. For the list of hosts, you can list subnets and/or IPs. In this example I picked the scanner itself.
For the PortList, The default can be used but when possible I like to scan All TCP and Nmap top 100 UDP ports as many times applications run on non standard ports.
If you feel comfortable providing your scanner credentials it can login and perform authenticated vulnerability checks as some may not be able to be detected anonymously.
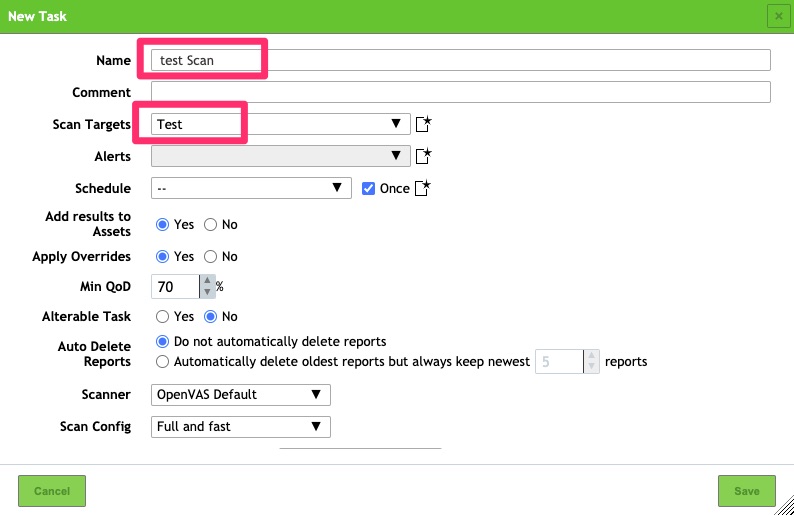
Under Scans / Tasks we want to create a new Scan Task
GSA – Scan Task
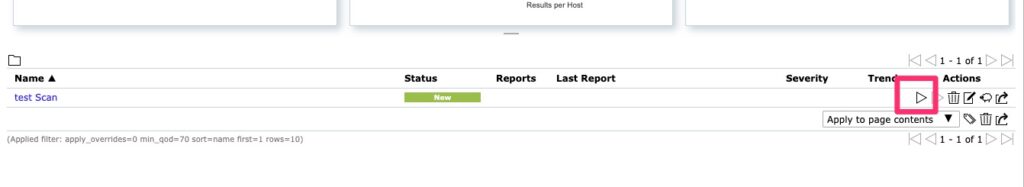
Once that has been created and saved a scan can be kicked off.
GSA – Run Scan
When running a scan it can take some time and that is determined by the remote endpoint but it is not uncommon for it to take 30 minutes per IP address depending on how quickly the endpoint can be scanned and what it finds. By default it does have quite a bit of concurrency and in order to fully utilize that you may have to tune your CPU and RAM configurations but that is out of scope for this document.
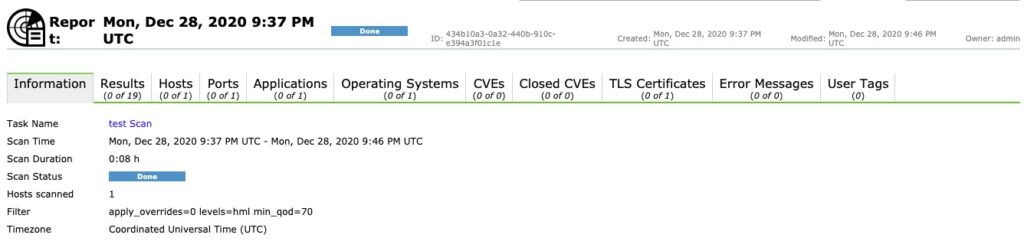
Once a scan is complete you have a report. Unfortunately this scan did not turn up much due to it being already fairly secure but this is what you can expect to see!
gsa – report
Final Words
That is it! You now have a vulnerability scanner you can use to scan your network for vulnerabilities. If you choose to use this for your vulnerability management needs, tweaks will need to be applied to port ranges, hosts and other settings but in a nutshell this is the nuts and bolts of what you need.
Some time ago when I was just learning Kubernetes, I wrote a series of articles that started with Intro To Kubernetes. This was on an earlier version (1.14) where many of these manual steps worked. Spinning up a new instance on 1.17, these steps really did not hold up and the cluster was not fully functional. I decided to give kubeadm init a try and it made my life infinitely easier.
Many of the provisioning steps in Intro To Kubernetes are similar, if not the same. Instead of manually starting services on hardware though, kubeadm spins up a bit of it as pods which saves time.
For this lab we need a VM we will name kcp1 (Kubernetes Control Plane 1). Since most of the master/slave terminology is going by the wayside to be more sensitive to what it represented in the past, what was previously referred to as master is now a control plane. The nodes were almost always referred to as worker nodes so it makes sense.
kcp1 needs 2GB of RAM and 2 cores/vCPUs. kwn1 can get away with 1GB RAM and 1 core. For storage, since this is a test lab, 8GB is more than sufficient. For the OS, I still am using VMware Photon OS version 3. I choose the ISO and its a quick install – https://vmware.github.io/photon/. PhotonOS was chosen because it is highly optimized for being a VM and minimized to be a very light weight OS to run docker containers. These traits make it perfect for running Kubernetes.
Installing Packages
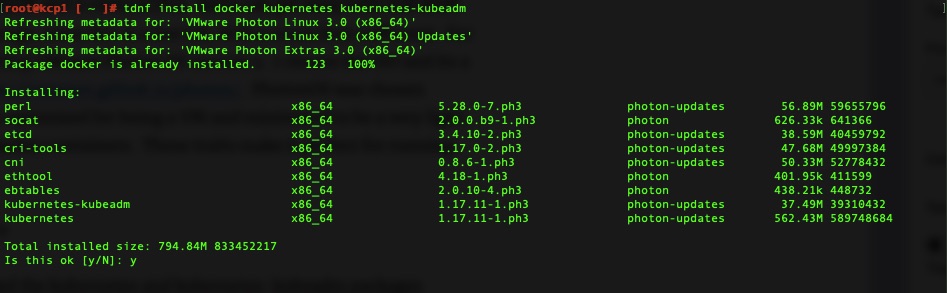
For this we will need the kubernetes and kubernetes-kubeadm packages installed. It also requires iptables and docker but that comes installed even on the minimal install.
tdnf install docker kubernetes kubernetes-kubeadm
Install and we’re off to the races! We’ll need this on kcp1 and kwn1.
Firewall Rules
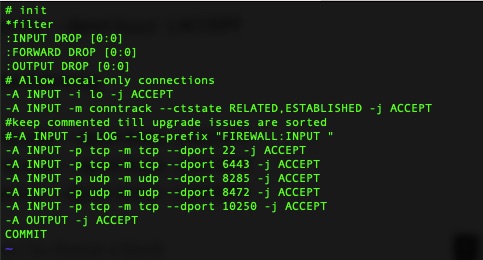
In order for key parts of it to work, we’ll need to open a few firewall rules. This is done by editing /etc/systemd/scripts/ip4save and adding a few lines and then restarting iptables.
kcp1 needs the following line. This is for the API calls which must of the cluster makes to the control plane nodes.
-A INPUT -p udp -m udp --dport 8285 -j ACCEPT
-A INPUT -p udp -m udp --dport 8472 -j ACCEPT
-A INPUT -p tcp -m tcp --dport 10250 -j ACCEPT
It should look something like this afterwards
/etc/systemd/scripts/ip4save
Then a simple restart to make the rules take effect.
systemctl restart iptables
kubeadm init Magic!
The magic here is kubeadm init. We need to use something like flannel for the pod network overlay. We don’t get into that in this article but if we don’t pass the right flags for that into kubeadm init, it won’t work. Per flannel
This needs to first be run on the control plane node.
kubeadm init --pod-network-cidr=10.244.0.0/16
On our first run we get some errors about docker not running. We need to enable and start it!
systemctl enable docker
systemctl start docker
Giving kubeadm init another run and its off! It may appear to hang for a minute and then spew out lines of actions its performing.
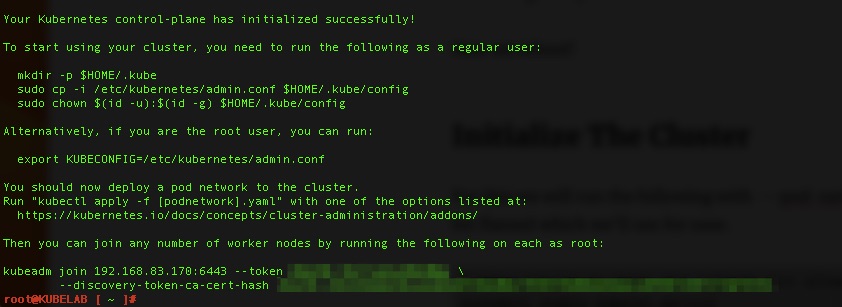
It will then tell you some next steps. It may seem like a lot.
Your Kubernetes control-plane has initialized successfully!

To start using your cluster, you need to run the following as a regular user:

  mkdir -p $HOME/.kube
  sudo cp -i /etc/kubernetes/admin.conf $HOME/.kube/config
  sudo chown $(id -u):$(id -g) $HOME/.kube/config

You should now deploy a pod network to the cluster.
Run "kubectl apply -f [podnetwork].yaml" with one of the options listed at:
  https://kubernetes.io/docs/concepts/cluster-administration/addons/

Then you can join any number of worker nodes by running the following on each as root:

kubeadm join 192.168.83.15:6443 --token xspmbf.kko3d24t74rpaeyo \
    --discovery-token-ca-cert-hash sha256:483e0e6ef33580b2c8f1e61210e3f50d8163dc6312b5d89940e38236cd2f04b6
For the most part these are copy and paste. The first three lines literally are so we’ll do that so we can use kubectl.
Minimal Configuration
One of the big remaining steps is to deploy a pod network, usually an overlay. As we mentioned earlier, I prefer flannel and it usually just works.
This just needs to be done via kubectl once. It instantiates a DaemonSet which essentially pushes this out to every node that attaches to the cluster.
Over on kwn1 we can run the join command it listed. It will take a little bit of time and then be done. Once done it recommends doing a “kubectl get nodes”.
root@kcp1 [ ~ ]# kubectl get nodes
NAME STATUS ROLES AGE VERSION
kcp1 Ready master 6m35s v1.17.11
kwn1 Ready 32s v1.17.11
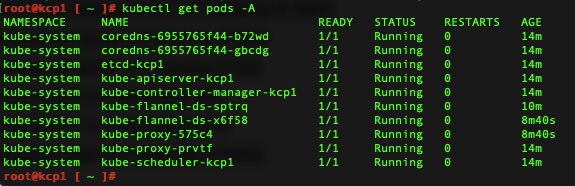
Validation
You can also check all the running pods to see the health. All is well and pretty turn key.
kubectl get pods -A
Final Thoughts
We have a working cluster that was fairly turn key and much easier than my earlier attempts. If you are fairly new to Kubernetes I would recommend deploying the dashboard which I outline Kubernetes Dashboard. This is mostly correct except that the version 2.0 is no longer beta and has a final release that works pretty well now.
My first real exposure to auditd has been deploying Rapid7 InsightIDR. Its been a great tool but I did not understand why they require auditd to be disabled. Is it not more secure having an audit daemon running? After a server had rebooted to completely disable this, it ran into a ton of performance issues and my path lead me down better understanding auditd.
What is Auditd?
At a high level it is a piece of software that allows you to view and audit actions being performed on the operating system. These actions can be directory listing, program execution, audit policy changes.
How is this Facilitated?
There are two pieces to the puzzle. There is a kernel based kauditd which queues up audit events for consumption. Various syscalls and other events cause an audit event to trigger.
These events are consumed via a userland auditd process. This process enables the auditing (via auditctl) and registers its PID and starts consuming events pushed through a PIPE. by default these events are simply logged to /var/log/audit/audit.log.
In the event that the auditd can’t consume these properly there is an audisp process that handles the overflow. Perhaps the auditd crashes but audit events are still pumped to the PIPE. Audisp will generically pump these to syslog which may push to /var/log/messages instead.
Auditctl
You can use the auditctl command to view the status or add rules. These rules would allow you to monitor extra resources or ignore certain ones.
auditctl -s
Why Does Rapid7 Want This Disabled?
The Rapid7 ir_agent has its own consumer process that scans the auditd events. Unfortunately (unless compatibility mode is enabled), only one process can consume these and Rapid7 wants its agent to be the consumer. It does so in an interesting way though. kauditd knows events can’t always be consumed in realtime so there are provisions for a backlog buffer which Rapid7 increases. It does this so a background job can run periodically to pull these events from the queue instead of listening in realtime. I’m not sure of the benefit of this method but it seems to work.
Without auditd disabled and stopped though, no others can listen, including Rapid7.
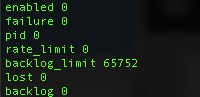
Here you can see, it is currently disabled and no pid is registered. Importantly though you can see the high backlog_limit (buffer). It is normally under 300 because auditd is running constantly.
So Why Did Our Server Blow Up?
Well, in our case its a server that generates a ton of audit logs because it kicks off tens of processes per second. It was easy to dump those to a audit.log file but a security tool actually parsing those just couldn’t keep up. We will either need to filter some of those auditd events or disable the agent.
Summary
If you ever need to use auditd, hopefully this gives you a basic insight into it.
Car owners increasingly complain about road vibrations. You may get some new tires and notice a vibration you can’t explain. Over time a vibration may start or get worse. You bring it in and they can’t find anything wrong and recommend a tire balance and rotation. The issue is still there but the issue can’t be found. On the repair shop side, a customer comes in with a vibration complaint. Maybe they are being picky and its a minor vibration that is normal. Or perhaps you find the vibration and fix it but they still complain about it. How do you quantify the mitigation of the vibration?
This is what the science of Noise Vibration Harshness (NVH) aims to address. NVH “scopes” have been around for decades but many times they are difficult to read and understand. Newer scopes that make this much easier are out of budget for many people and repair shops. For repair shops they don’t tend to make money off troubleshooting these kinds of issues so it is hard to justify the expense.
My Exposure
In full disclosure, I came across this with my own vehicle vibration. I took it into the dealer and they did not find anything but recommended a road force balance. It seemed to help a little but not really.
I was researching scientific methods of identifying the vibration and came across NVH. My intent is to use this data to help provide some guidance and extra data for the dealer when asking them to use a PicoScope. I always like going in, informed and being able to provide objective and quantifiable data to the any repair shop. I don’t know that this will actually help narrow it down but understanding the science of how more professional tools works was a neat discovery.
High Level Science
The high level science to how a scope like these work is that they detect vibrations and use calculations to convert that to frequencies in hertz (Hz). That is basically a quantification of how many times per second that vibration happens. Each set of components components that rotate has a set frequency it will vibrate at. For example, an engine at 1200 Rotations Per Minute (RPM) is rotating at 20 Rotations Per Second. A hertz is a unit of measurement that represents one cycle per second. Something that cycles 20 times per second or rotations per second would be 20Hz.
It becomes a little complicated because vibrations can have an order to them. In the above example of an engine at 1200 RPM. Its first order vibration would be 20Hz. A second order vibration would be 40Hz, doubling for each subsequent order. Certain components have natural vibrations at various orders. For example an 8 cylinder engine will have a 1st order vibration and a 4th order vibration. Each engine has a Nth order vibration that is equal to half of their cylinders in a standard 4 stroke engine.
Everything in a vehicle vibrations, so how do we know what to look for? The amplitude of each vibration is the key. Many software packages measure this in meters per second squared or mg or mili-gravity. The universal constant for gravity is 9.81 meters per second squared so something traveling at 1G is accelerating or increasing speed at a rate of 9.81 meters per second every second. In the automotive world, typical vibrations are so minimal that we use mili-gravity or mg.
Understanding the Science For Automotive
The key to this is to find order vibrations that relate to major components. A vibration that relates to the engine does not mean the engine is to blame. It just means that something that spins at the same rate as the engine is the cause. This could be an engine fan, crankshaft, camshaft or other moving part at the same speed or one of the vibration orders.
The same applies to tires. Just because you found a vibration that correlates to tires doesn’t mean it is the tires. It could be a wheel bearing or other part that moves at the same speed as the tire.
The third major component that is measured is a drive shaft or prop shaft(in rear wheel drive vehicles). These typically rotate at a fixed rate that is related to tires but also by a multiplier of what your rear end ratio is. The rear end ratio is usually not a whole number like 4 to 1 or 4:1. It is usually something like 3.73:1, 4.11:1 or 3.23:1. This allows us to differentiate it from tire vibration orders fairly easily.
Dealer Tools
To combat this, the Dealers have tools at their disposal. In particular, in recent times they have a PicoScope with NVH modules – https://www.picoauto.com/products/noise-vibration-and-balancing/nvh-overview. There is a specific version for GM. It has a price point into the thousands of dollars depending on the model of unit and how many NVH modules. More NVH modules gives you different reference points for the concern and helps isolate it to the area of the vehicle.
Once nice thing about PicoScope though is the software itself is free. If you can get a dealer or someone else to run the diagnostics and send you the file, you can open it up and view/analyze it.
Lower End tools
There are other options. Since smart phones have the necessary equipment to capture many of the metrics necessary, one in particular called “NVH App” by VibrateSoftware caught my eye. These types of software use your phone’s accelerometer to detect vibrations and its GPS to detect speed. It is unfortunately out of most people’s budget @ $399.00USD. It does put it closer to budget for smaller repair shops though or hobbyists that deal with these kinds of issues frequently. Personally I think if they had a 3-4 day subscription for $50, more people would go for it or allow a yearly repair shop price of $399 it may do better. Even AC Delco’s TIS2WEB lets you have 3 day prices on their software. In any case it is very promising.
Even Cheaper!
If you really want to save a buck though, there are quite a few vibration apps not specifically geared towards this use case that you can use. I went through a few of them and came across myFrequency by APPtodate. It was fairly economical at around $9. The main feature you need is the ability to detect multiple frequencies at the same time. I won’t claim to understand the math behind it but I believe it has to do with determining velocities of the vibrations to distinguish them from each other when you’re using one accelerometer.
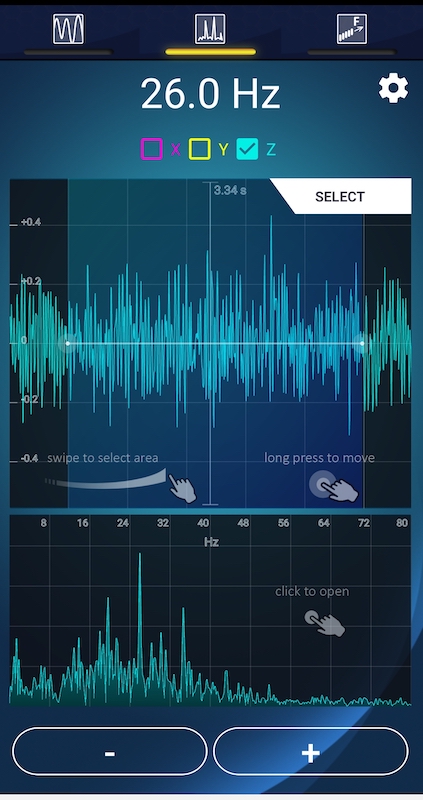
In this particular example I was driving my truck at 50mph and maintaining 1200rpm. The tires are P275/55R20 and rear end ratio is 3.23:1. We’ll get into later on what that all means. From here you can see the top frequency by amplitude is 26Hz. Drilling into the app it is at 53.52mg which is substantial.
Vibration Analysis in X axis
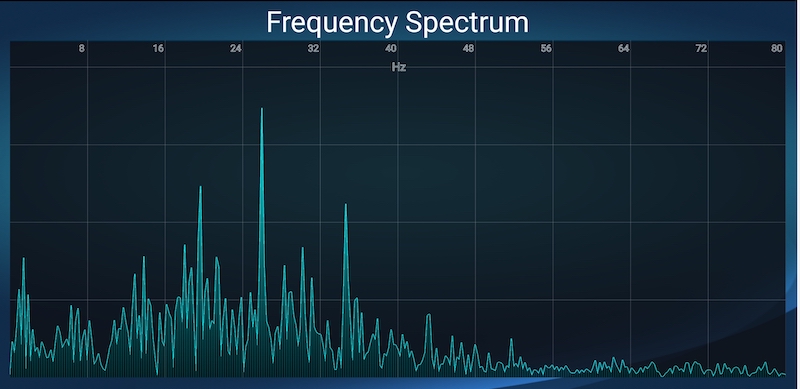
Here you can see the full frequency spectrum
Frequency Spectrum Analysis
This does however require you to do quite a few calculations and use a constant RPM and speed for the duration of the test. These tests are usually only 10-20 seconds so it is possible.
Deep Dive Into Math
As discussed, engine Hz is the easiest to calculate. Simply divide RPM by 60 to get RPS or Hz. In the above case 1200RPM / 60 = 20Hz.
At 50mph, the tire RPM becomes a little more lenghty. My tires are P275/55R20 which using a tire calculator like https://tiresize.com/calculator/ comes out to 31.9 inch diameter. 31.9 * 3.1416 (constant of PI) gives us 100.2 inch circumference. We already knew that because the calculator provides it. Divide that by 12 and we get 8.35 foot circumference. Every rotation of the tire goes 8.35 feet.
Every mile has 5280 feet in it. 50 miles per hour multiplied by 5280 gives us feet per hour. Divide that by 60 to get 4400 feet per minute. Divide that by 8.35 feet to come to 526.95 RPM. We can then divide that by 60 to get 8.78 as our first order tire vibration.
The rear end of 3.23 means that that prop shaft turns 3.23 times per one turn of the tire or every tire RPM/Hz equals 3.23 turns of the prop shaft. Multiplying 8.78 by 3.23 comes out to 28.36 Hz.
So now we have our first order vibrations of Engine 20Hz, Tire 8.78Hz and 28.36Hz of the prop shaft. We’re also looking for direct multiples of those as well.
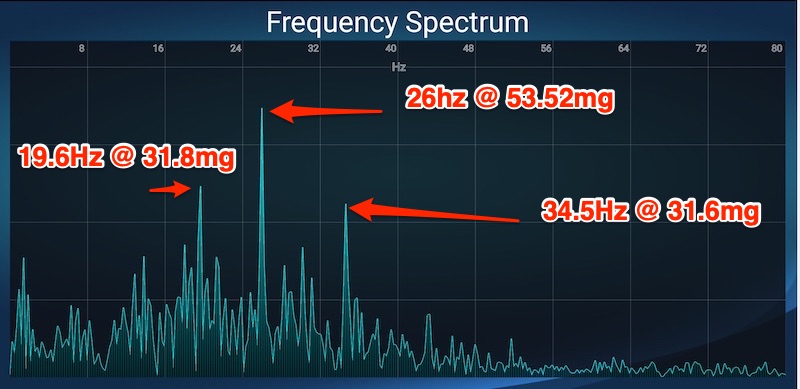
Reading the Graph
Pointing out some of the peaks of the graph, you can see we have a 20Hz disturbance with a high amplitude and a 26Hz one as well. 20Hz matches up to the engine and 26 is fairly close. Usually it would have to be closer but I’ve not found the proper mounting point of the vehicle yet. I’m also just starting to take these measurements.
Some things could make the tire and prop shaft skew like not keeping exact speed and the fact that while tire diameters are the factory spec, when you put a vehicle on them they will not have a perfect diameter that matches. Tire wear can also play a little in the numbers.
In any case, this particular one seems to point more to engine RPM so I’ll likely take it for another run and bring up the engine RPM. This particular truck has had torque converter lockup issues and pulsates the TCC at around 1200RPM so I could be catching that pulsation on the TCC.
Final Words
If you don’t have access to a shop that has a PicoScope or similar NVH and don’t have the budget for the NVH app, you may have what you need to perform these calculations on your own. In my case I created a spreadsheet to calculate these frequencies based on engine RPM, speed and a few vehicle variables. For my test runs I just need to plus in the variables and see where the graphs line up.
Phone mounting is a huge variable in this. The more professional tools have heavy duty magnets that you adhere to the seat rail which is an excellent position to detect vibration. You can move them to various seats to find the source of the vibration as the amplitude is limited.
With a phone it is more difficult to find mounting points in various spots int he vehicle but hopefully this gives you an economical method to track down vibrations.