Summary
Car owners increasingly complain about road vibrations. You may get some new tires and notice a vibration you can’t explain. Over time a vibration may start or get worse. You bring it in and they can’t find anything wrong and recommend a tire balance and rotation. The issue is still there but the issue can’t be found. On the repair shop side, a customer comes in with a vibration complaint. Maybe they are being picky and its a minor vibration that is normal. Or perhaps you find the vibration and fix it but they still complain about it. How do you quantify the mitigation of the vibration?
This is what the science of Noise Vibration Harshness (NVH) aims to address. NVH “scopes” have been around for decades but many times they are difficult to read and understand. Newer scopes that make this much easier are out of budget for many people and repair shops. For repair shops they don’t tend to make money off troubleshooting these kinds of issues so it is hard to justify the expense.
My Exposure
In full disclosure, I came across this with my own vehicle vibration. I took it into the dealer and they did not find anything but recommended a road force balance. It seemed to help a little but not really.
I was researching scientific methods of identifying the vibration and came across NVH. My intent is to use this data to help provide some guidance and extra data for the dealer when asking them to use a PicoScope. I always like going in, informed and being able to provide objective and quantifiable data to the any repair shop. I don’t know that this will actually help narrow it down but understanding the science of how more professional tools works was a neat discovery.
High Level Science
The high level science to how a scope like these work is that they detect vibrations and use calculations to convert that to frequencies in hertz (Hz). That is basically a quantification of how many times per second that vibration happens. Each set of components components that rotate has a set frequency it will vibrate at. For example, an engine at 1200 Rotations Per Minute (RPM) is rotating at 20 Rotations Per Second. A hertz is a unit of measurement that represents one cycle per second. Something that cycles 20 times per second or rotations per second would be 20Hz.
It becomes a little complicated because vibrations can have an order to them. In the above example of an engine at 1200 RPM. Its first order vibration would be 20Hz. A second order vibration would be 40Hz, doubling for each subsequent order. Certain components have natural vibrations at various orders. For example an 8 cylinder engine will have a 1st order vibration and a 4th order vibration. Each engine has a Nth order vibration that is equal to half of their cylinders in a standard 4 stroke engine.
Everything in a vehicle vibrations, so how do we know what to look for? The amplitude of each vibration is the key. Many software packages measure this in meters per second squared or mg or mili-gravity. The universal constant for gravity is 9.81 meters per second squared so something traveling at 1G is accelerating or increasing speed at a rate of 9.81 meters per second every second. In the automotive world, typical vibrations are so minimal that we use mili-gravity or mg.
Understanding the Science For Automotive
The key to this is to find order vibrations that relate to major components. A vibration that relates to the engine does not mean the engine is to blame. It just means that something that spins at the same rate as the engine is the cause. This could be an engine fan, crankshaft, camshaft or other moving part at the same speed or one of the vibration orders.
The same applies to tires. Just because you found a vibration that correlates to tires doesn’t mean it is the tires. It could be a wheel bearing or other part that moves at the same speed as the tire.
The third major component that is measured is a drive shaft or prop shaft(in rear wheel drive vehicles). These typically rotate at a fixed rate that is related to tires but also by a multiplier of what your rear end ratio is. The rear end ratio is usually not a whole number like 4 to 1 or 4:1. It is usually something like 3.73:1, 4.11:1 or 3.23:1. This allows us to differentiate it from tire vibration orders fairly easily.
Dealer Tools
To combat this, the Dealers have tools at their disposal. In particular, in recent times they have a PicoScope with NVH modules – https://www.picoauto.com/products/noise-vibration-and-balancing/nvh-overview. There is a specific version for GM. It has a price point into the thousands of dollars depending on the model of unit and how many NVH modules. More NVH modules gives you different reference points for the concern and helps isolate it to the area of the vehicle.
Once nice thing about PicoScope though is the software itself is free. If you can get a dealer or someone else to run the diagnostics and send you the file, you can open it up and view/analyze it.
Lower End tools
There are other options. Since smart phones have the necessary equipment to capture many of the metrics necessary, one in particular called “NVH App” by VibrateSoftware caught my eye. These types of software use your phone’s accelerometer to detect vibrations and its GPS to detect speed. It is unfortunately out of most people’s budget @ $399.00USD. It does put it closer to budget for smaller repair shops though or hobbyists that deal with these kinds of issues frequently. Personally I think if they had a 3-4 day subscription for $50, more people would go for it or allow a yearly repair shop price of $399 it may do better. Even AC Delco’s TIS2WEB lets you have 3 day prices on their software. In any case it is very promising.
Even Cheaper!
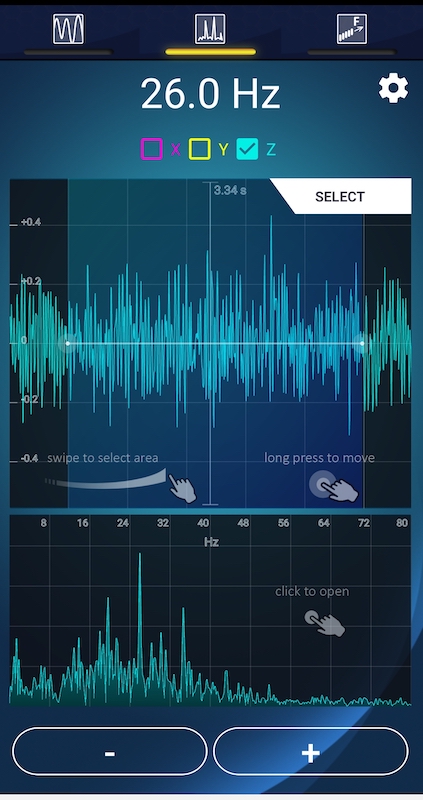
If you really want to save a buck though, there are quite a few vibration apps not specifically geared towards this use case that you can use. I went through a few of them and came across myFrequency by APPtodate. It was fairly economical at around $9. The main feature you need is the ability to detect multiple frequencies at the same time. I won’t claim to understand the math behind it but I believe it has to do with determining velocities of the vibrations to distinguish them from each other when you’re using one accelerometer.
In this particular example I was driving my truck at 50mph and maintaining 1200rpm. The tires are P275/55R20 and rear end ratio is 3.23:1. We’ll get into later on what that all means. From here you can see the top frequency by amplitude is 26Hz. Drilling into the app it is at 53.52mg which is substantial.
Here you can see the full frequency spectrum
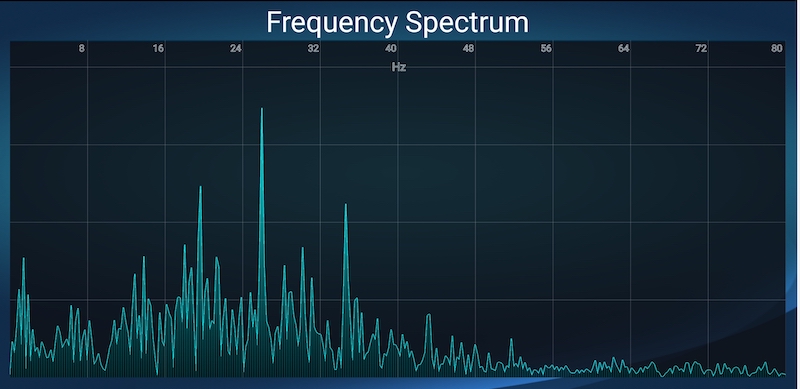
This does however require you to do quite a few calculations and use a constant RPM and speed for the duration of the test. These tests are usually only 10-20 seconds so it is possible.
Deep Dive Into Math
As discussed, engine Hz is the easiest to calculate. Simply divide RPM by 60 to get RPS or Hz. In the above case 1200RPM / 60 = 20Hz.
At 50mph, the tire RPM becomes a little more lenghty. My tires are P275/55R20 which using a tire calculator like https://tiresize.com/calculator/ comes out to 31.9 inch diameter. 31.9 * 3.1416 (constant of PI) gives us 100.2 inch circumference. We already knew that because the calculator provides it. Divide that by 12 and we get 8.35 foot circumference. Every rotation of the tire goes 8.35 feet.
Every mile has 5280 feet in it. 50 miles per hour multiplied by 5280 gives us feet per hour. Divide that by 60 to get 4400 feet per minute. Divide that by 8.35 feet to come to 526.95 RPM. We can then divide that by 60 to get 8.78 as our first order tire vibration.
The rear end of 3.23 means that that prop shaft turns 3.23 times per one turn of the tire or every tire RPM/Hz equals 3.23 turns of the prop shaft. Multiplying 8.78 by 3.23 comes out to 28.36 Hz.
So now we have our first order vibrations of Engine 20Hz, Tire 8.78Hz and 28.36Hz of the prop shaft. We’re also looking for direct multiples of those as well.
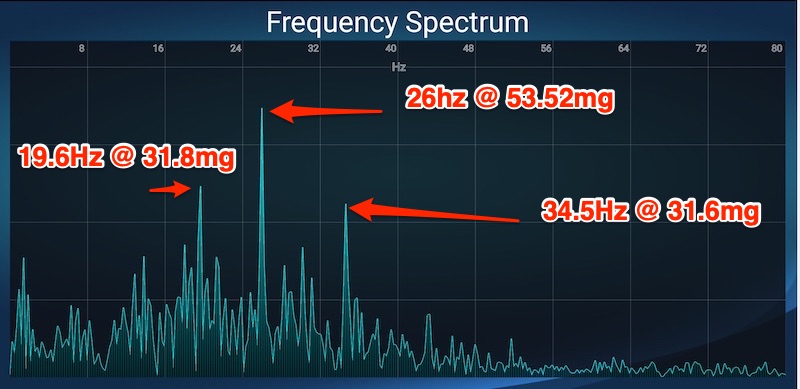
Reading the Graph
Pointing out some of the peaks of the graph, you can see we have a 20Hz disturbance with a high amplitude and a 26Hz one as well. 20Hz matches up to the engine and 26 is fairly close. Usually it would have to be closer but I’ve not found the proper mounting point of the vehicle yet. I’m also just starting to take these measurements.
Some things could make the tire and prop shaft skew like not keeping exact speed and the fact that while tire diameters are the factory spec, when you put a vehicle on them they will not have a perfect diameter that matches. Tire wear can also play a little in the numbers.
In any case, this particular one seems to point more to engine RPM so I’ll likely take it for another run and bring up the engine RPM. This particular truck has had torque converter lockup issues and pulsates the TCC at around 1200RPM so I could be catching that pulsation on the TCC.
Final Words
If you don’t have access to a shop that has a PicoScope or similar NVH and don’t have the budget for the NVH app, you may have what you need to perform these calculations on your own. In my case I created a spreadsheet to calculate these frequencies based on engine RPM, speed and a few vehicle variables. For my test runs I just need to plus in the variables and see where the graphs line up.
Phone mounting is a huge variable in this. The more professional tools have heavy duty magnets that you adhere to the seat rail which is an excellent position to detect vibration. You can move them to various seats to find the source of the vibration as the amplitude is limited.
With a phone it is more difficult to find mounting points in various spots int he vehicle but hopefully this gives you an economical method to track down vibrations.